
Growth Investment Strategy: Guide + Best Stocks
Discover the principles of growth investing, how Bastion scores companies, and the top stocks leading global growth today.

1. What is Growth Investing?
The goal of this strategy is to build a portfolio of companies with the strongest prospects for business expansion. Investors who follow this approach focus on future incomes, expecting companies to scale their operations significantly. As a result, traditional valuation multiples or current efficiency metrics play a secondary role in this method. The key emphasis is on the potential for revenue and earnings growth.
Examples of Growth Investors:
Thomas Rowe Price Jr., founder and manager of T. Rowe Price, is widely regarded as a pioneer of growth investing. His philosophy is often summarized as “growth at any price,” emphasizing long-term prospects while placing little weight on current valuations.
Philip Fisher, another early champion of growth investing, argued that investors should move beyond traditional valuation multiples. Instead, he emphasized selecting companies with the greatest potential for sustained revenue and earnings expansion.
Cathie Wood, founder of ARK Invest, is one of the most notable modern advocates of this approach. Her funds focus on innovation and future earnings, often disregarding valuation multiples altogether and prioritizing the scale and transformative potential of the businesses she invests in.
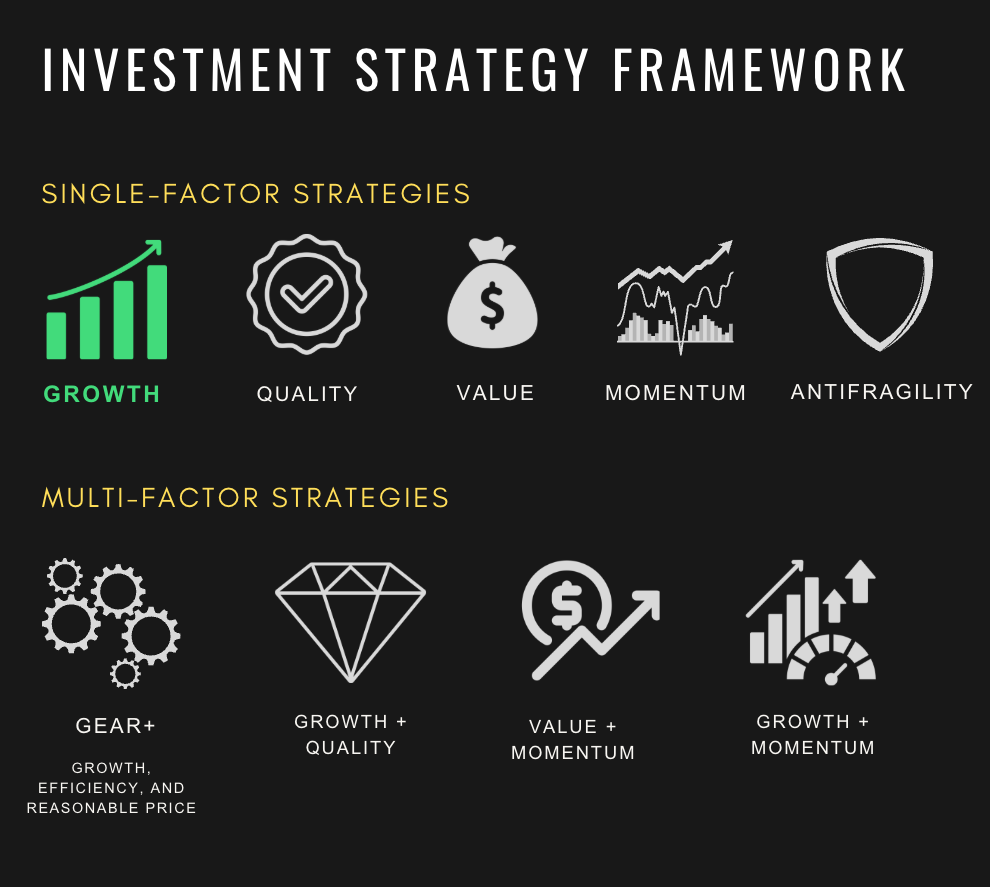
At Bastion, we have developed a systematic framework to identify the best growth stocks worldwide.
2. Key Metrics and Growth Rating Calculation
A quick reminder of how the Bastion rating is calculated:
Key metrics are selected depending on the strategy.
Each stock receives a score from 1 to 10 for every metric. A score of 10 means the stock ranks in the top 10% globally for that metric, 9 means the top 20%, and so on.
Scores are then weighted and combined into a final composite rating.
The table below outlines the core metrics used in the Growth rating calculation.
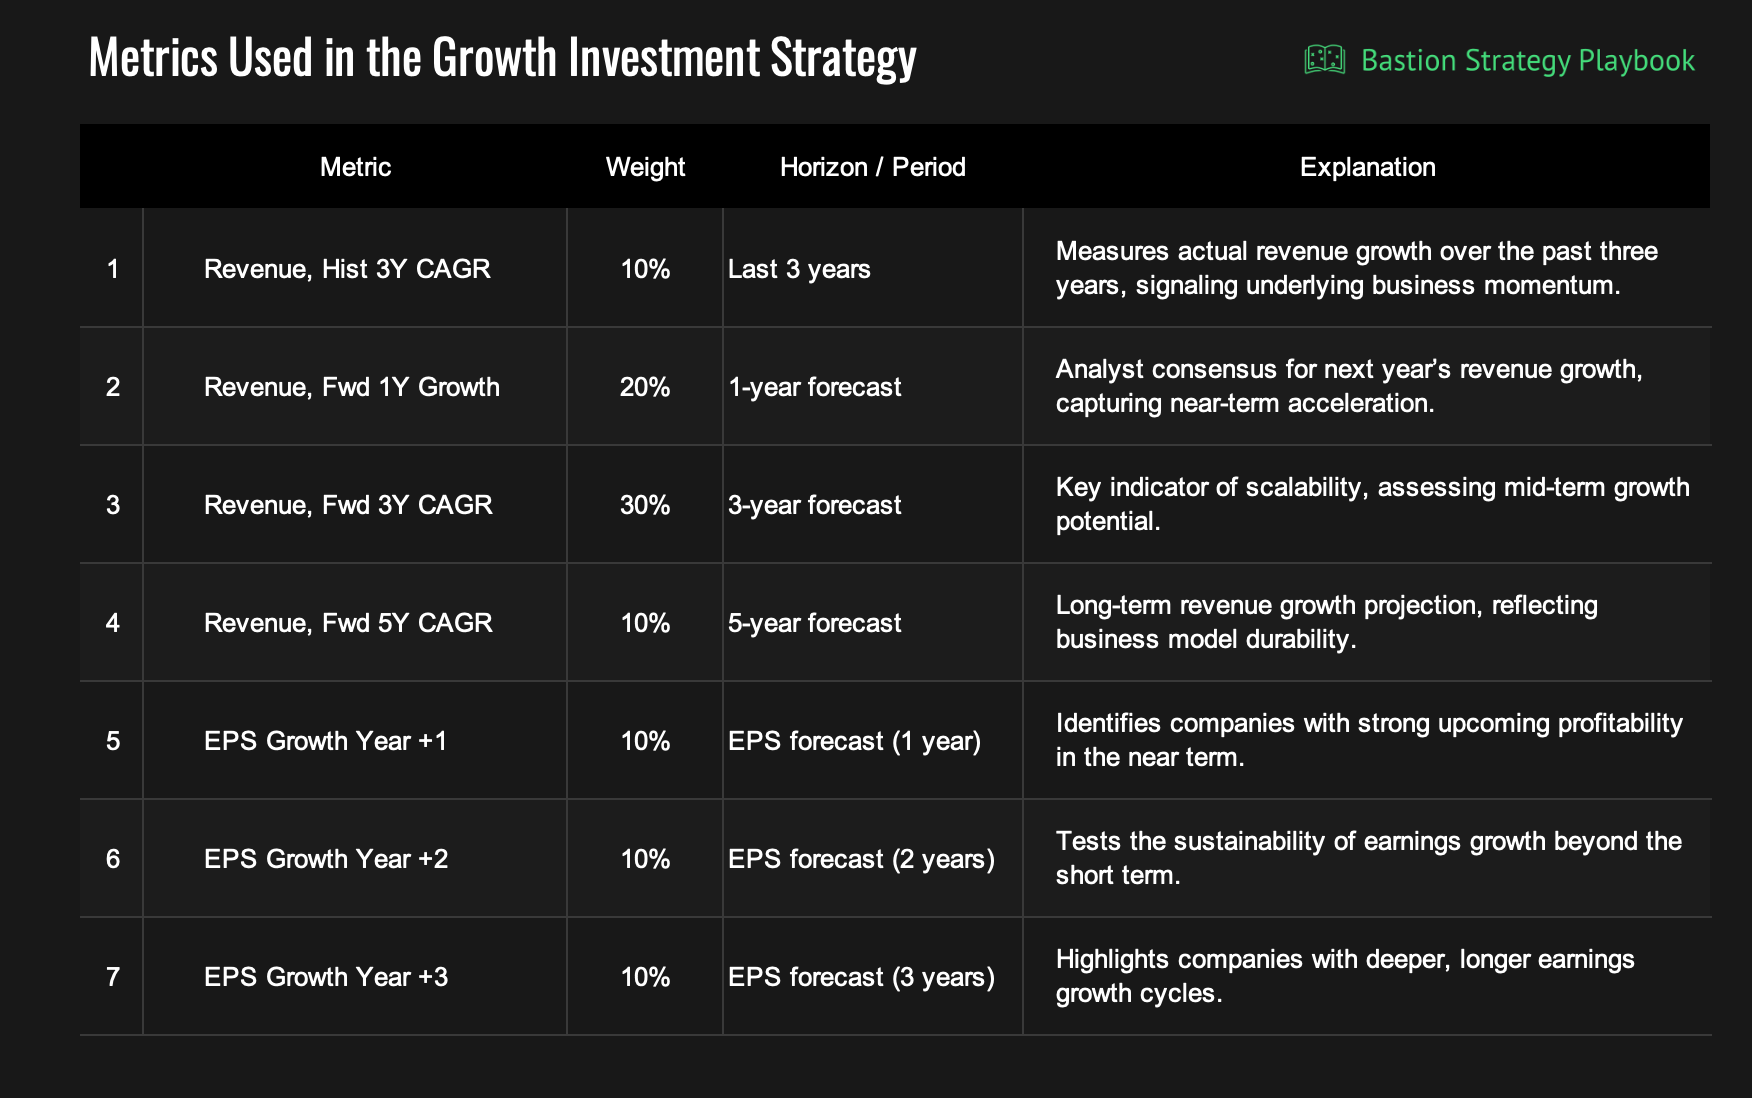
Commentary
The two primary components are revenue growth and earnings-per-share (EPS) growth. Revenue growth reflects the expansion of a company’s core business, while EPS growth shows how effectively that expansion translates into profitability.
Why specifically these two, and not EBITDA growth or free cash flow growth? My backtests show that adding such metrics has little impact on the final rating. Moreover, for many companies around the world, forward-looking forecasts for EBITDA or FCF are hard or nearly impossible to find. For universality and consistency, the focus is on revenue and earnings.
If a company transitions from losses to profitability, it receives a neutral score of 5.
The weighting scheme (70% revenue growth, 30% earnings growth) reflects the reality of growth companies. Revenue is typically more predictable than earnings, and many early-stage or high-growth companies may not yet be profitable. This makes revenue the more important driver in the rating.
The 3-year revenue growth forecast carries the largest single weight (30%). (1) This metric is broadly available across companies, unlike 5-year projections, which are far less common. (2) A 3-year horizon is both long enough to capture meaningful business scaling and short enough to remain analytically reliable.
Banks and certain financial-sector companies do not have revenue in the traditional sense. For this reason, the Growth rating is not calculated for them.
Most of the rating is based on growth forecasts. Typically, these are AI-driven Bastion model estimates built on public and non-public analyst consensus data. I believe it is more important to look forward than backward, so forward-looking metrics are prioritized. Forecasts can be wrong, but I consider them a better foundation than historical data.
3. Rating Example: Growth Score Leaders Among the Top 100 US Companies
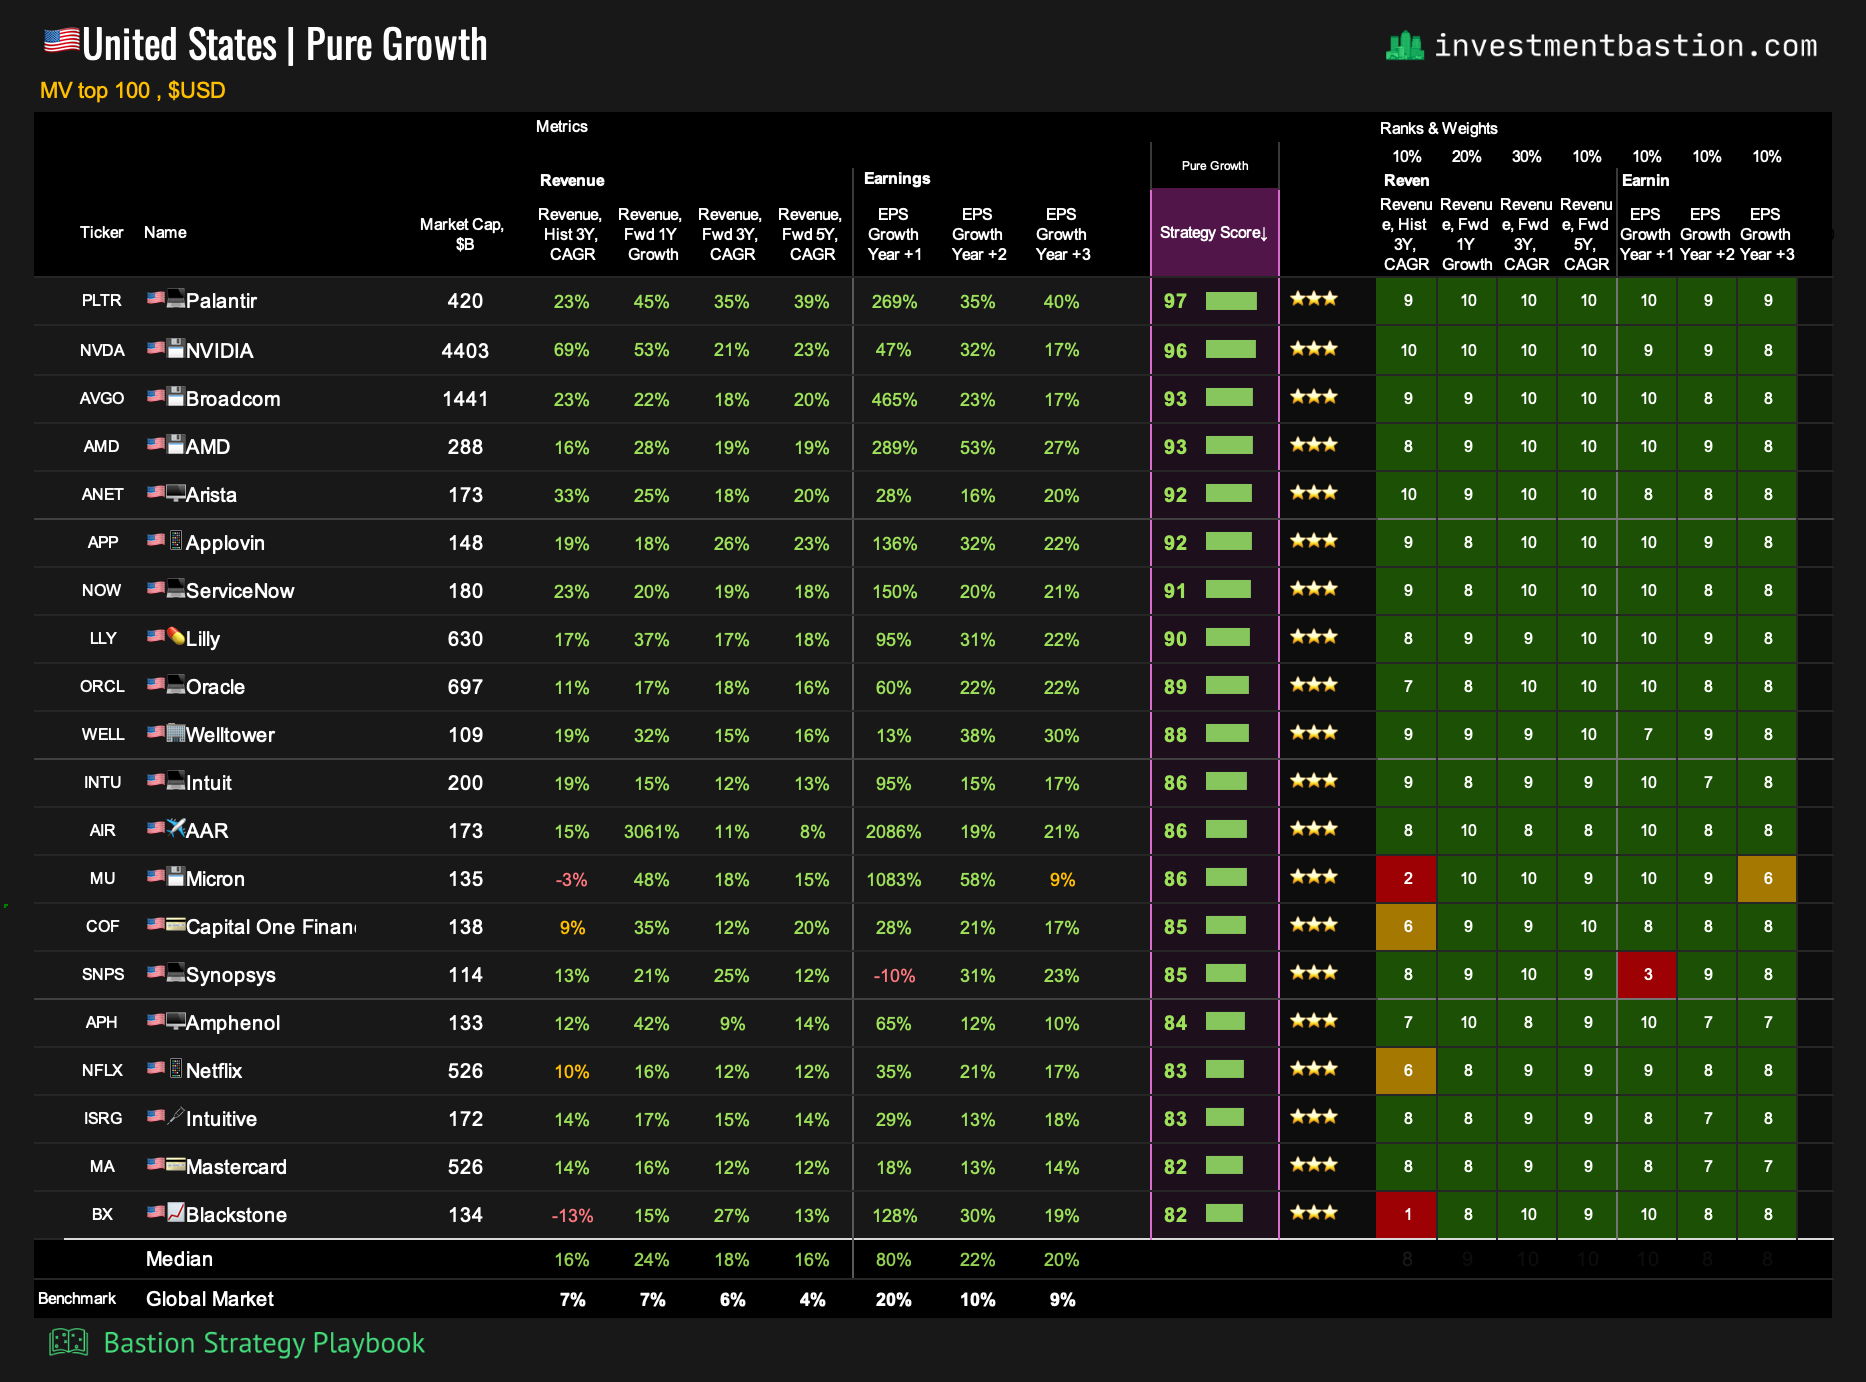
Nearly all of today’s leaders within the US 100 universe are tied to the artificial intelligence sector. Three of the top five Growth stocks are semiconductor manufacturers (Nvidia, Broadcom, AMD). Palantir ranks first, supported by an exceptional projected 3-year revenue growth rate of roughly 35% per year.
A Step Further: Growth + GEAR+ Score
I usually don’t look at the pure Growth rating in isolation, but rather in combination with other factors. In the Strategy Playbook file, there is a Key Statistics panel to the right of the strategy rating dashboard designed for this purpose.
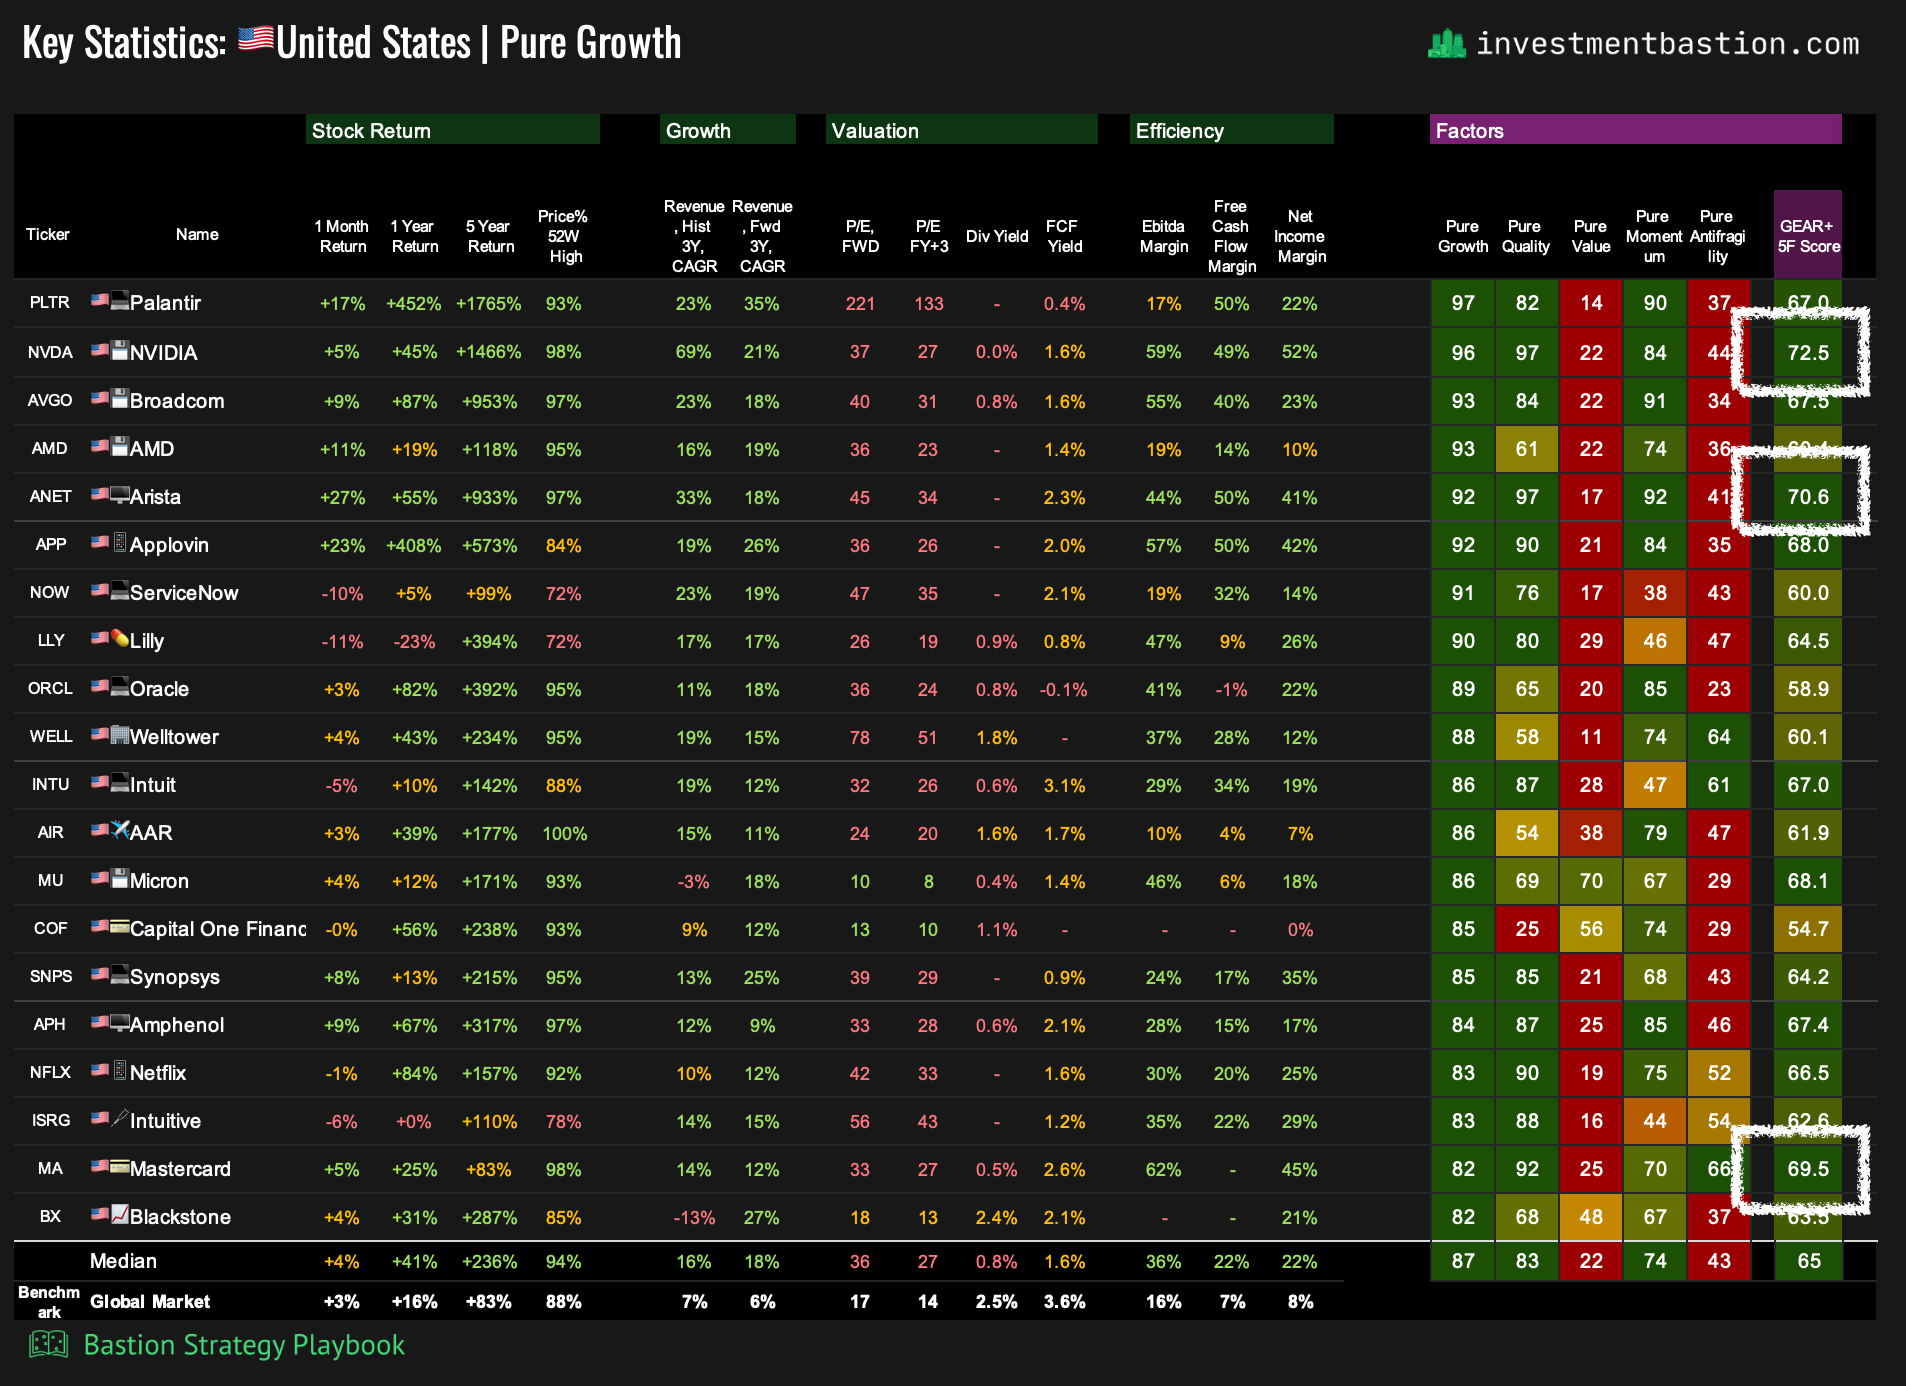
For example, I’m particularly interested in growth stocks that also score highly on the GEAR+ five-factor model (a detailed guide to this strategy will follow later). This means that, in addition to growth, these companies also demonstrate strong quality and more attractive valuations. Nvidia, Arista Networks, and Mastercard all fall into this category.
Growth + Weak Momentum
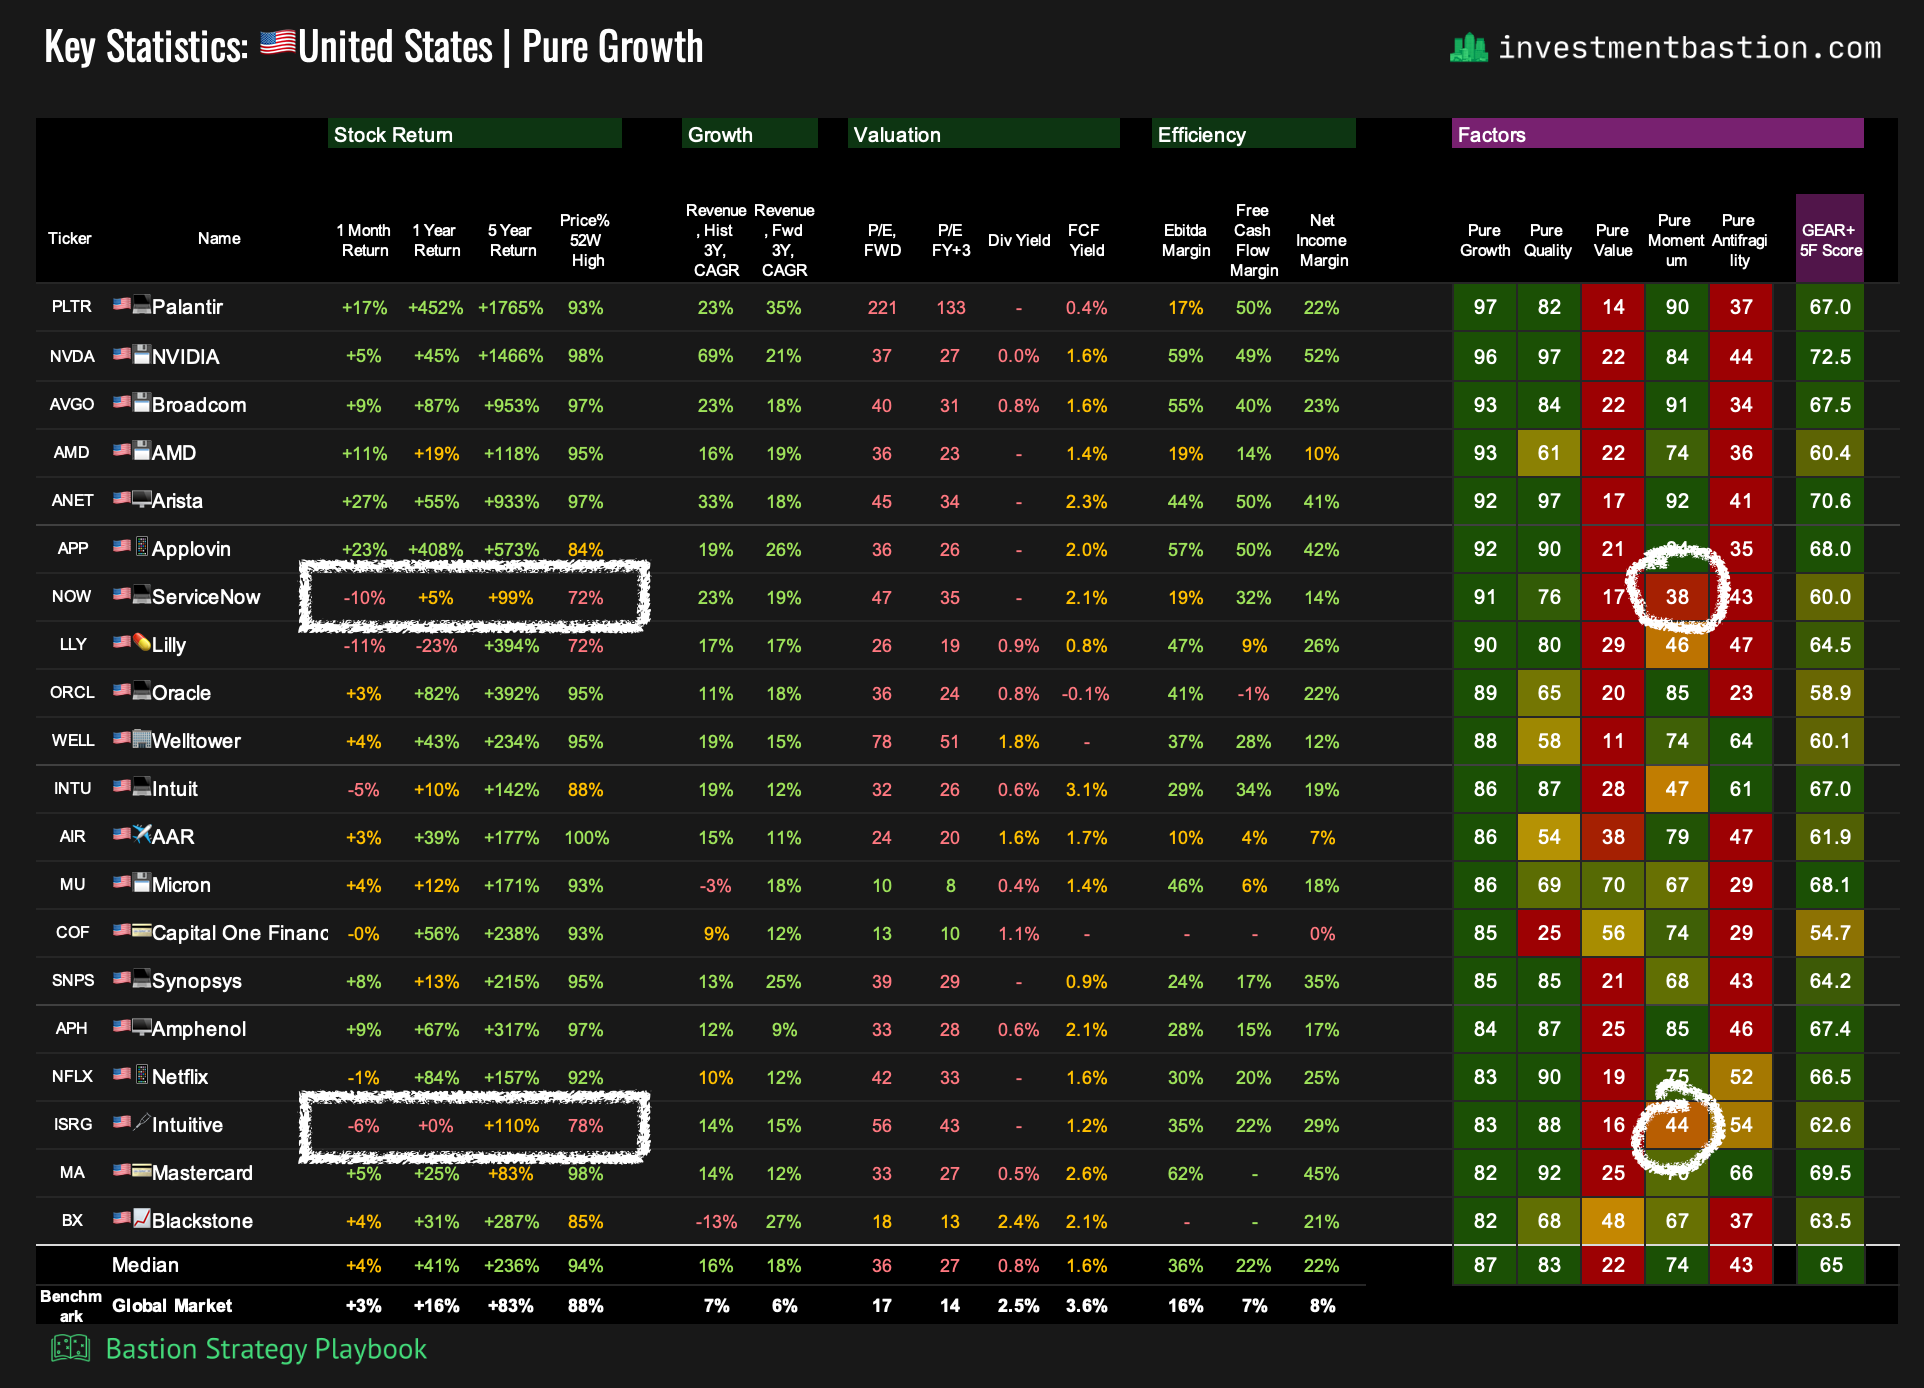
Stocks that have pulled back in price and remain far below their 52-week highs, but still retain strong growth prospects, may offer recovery potential. These are worth keeping on the watchlist. Current examples include ServiceNow and Intuitive Surgical.
Growth + Low Forward Multiples
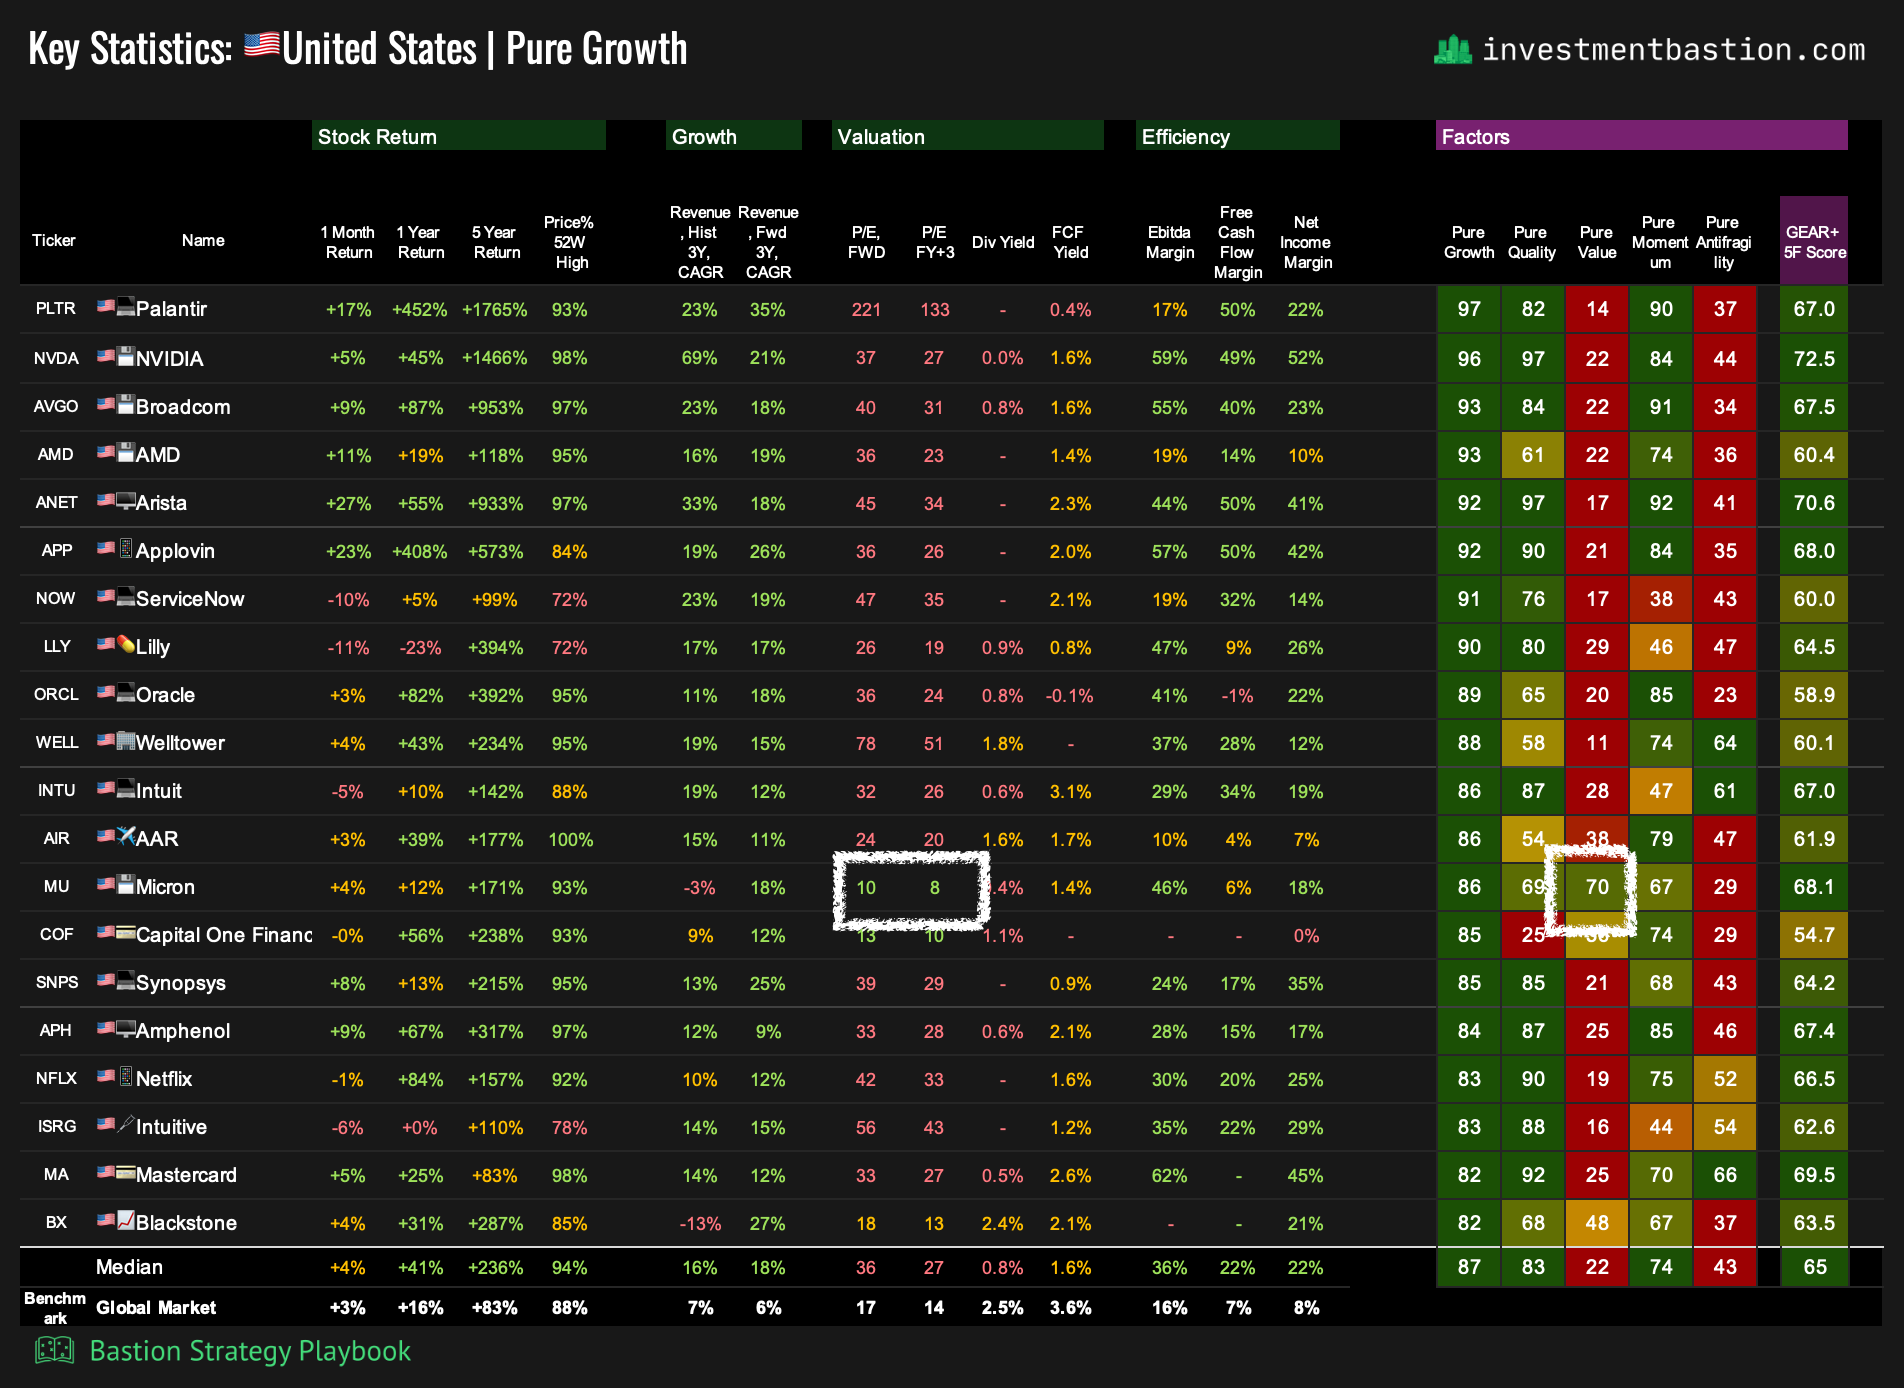
This is the classic valuation mismatch: high growth rates combined with relatively low valuation multiples. In today’s market, the most notable example among large growth companies is Micron, a leading memory chip producer. That said, caution is warranted, as a cheap valuation may also reflect risks not fully captured by the scoring model.
4. Growth Leaders Across Regions and Sectors
In this section, we look at potential candidates for growth portfolios beyond US large-cap stocks.
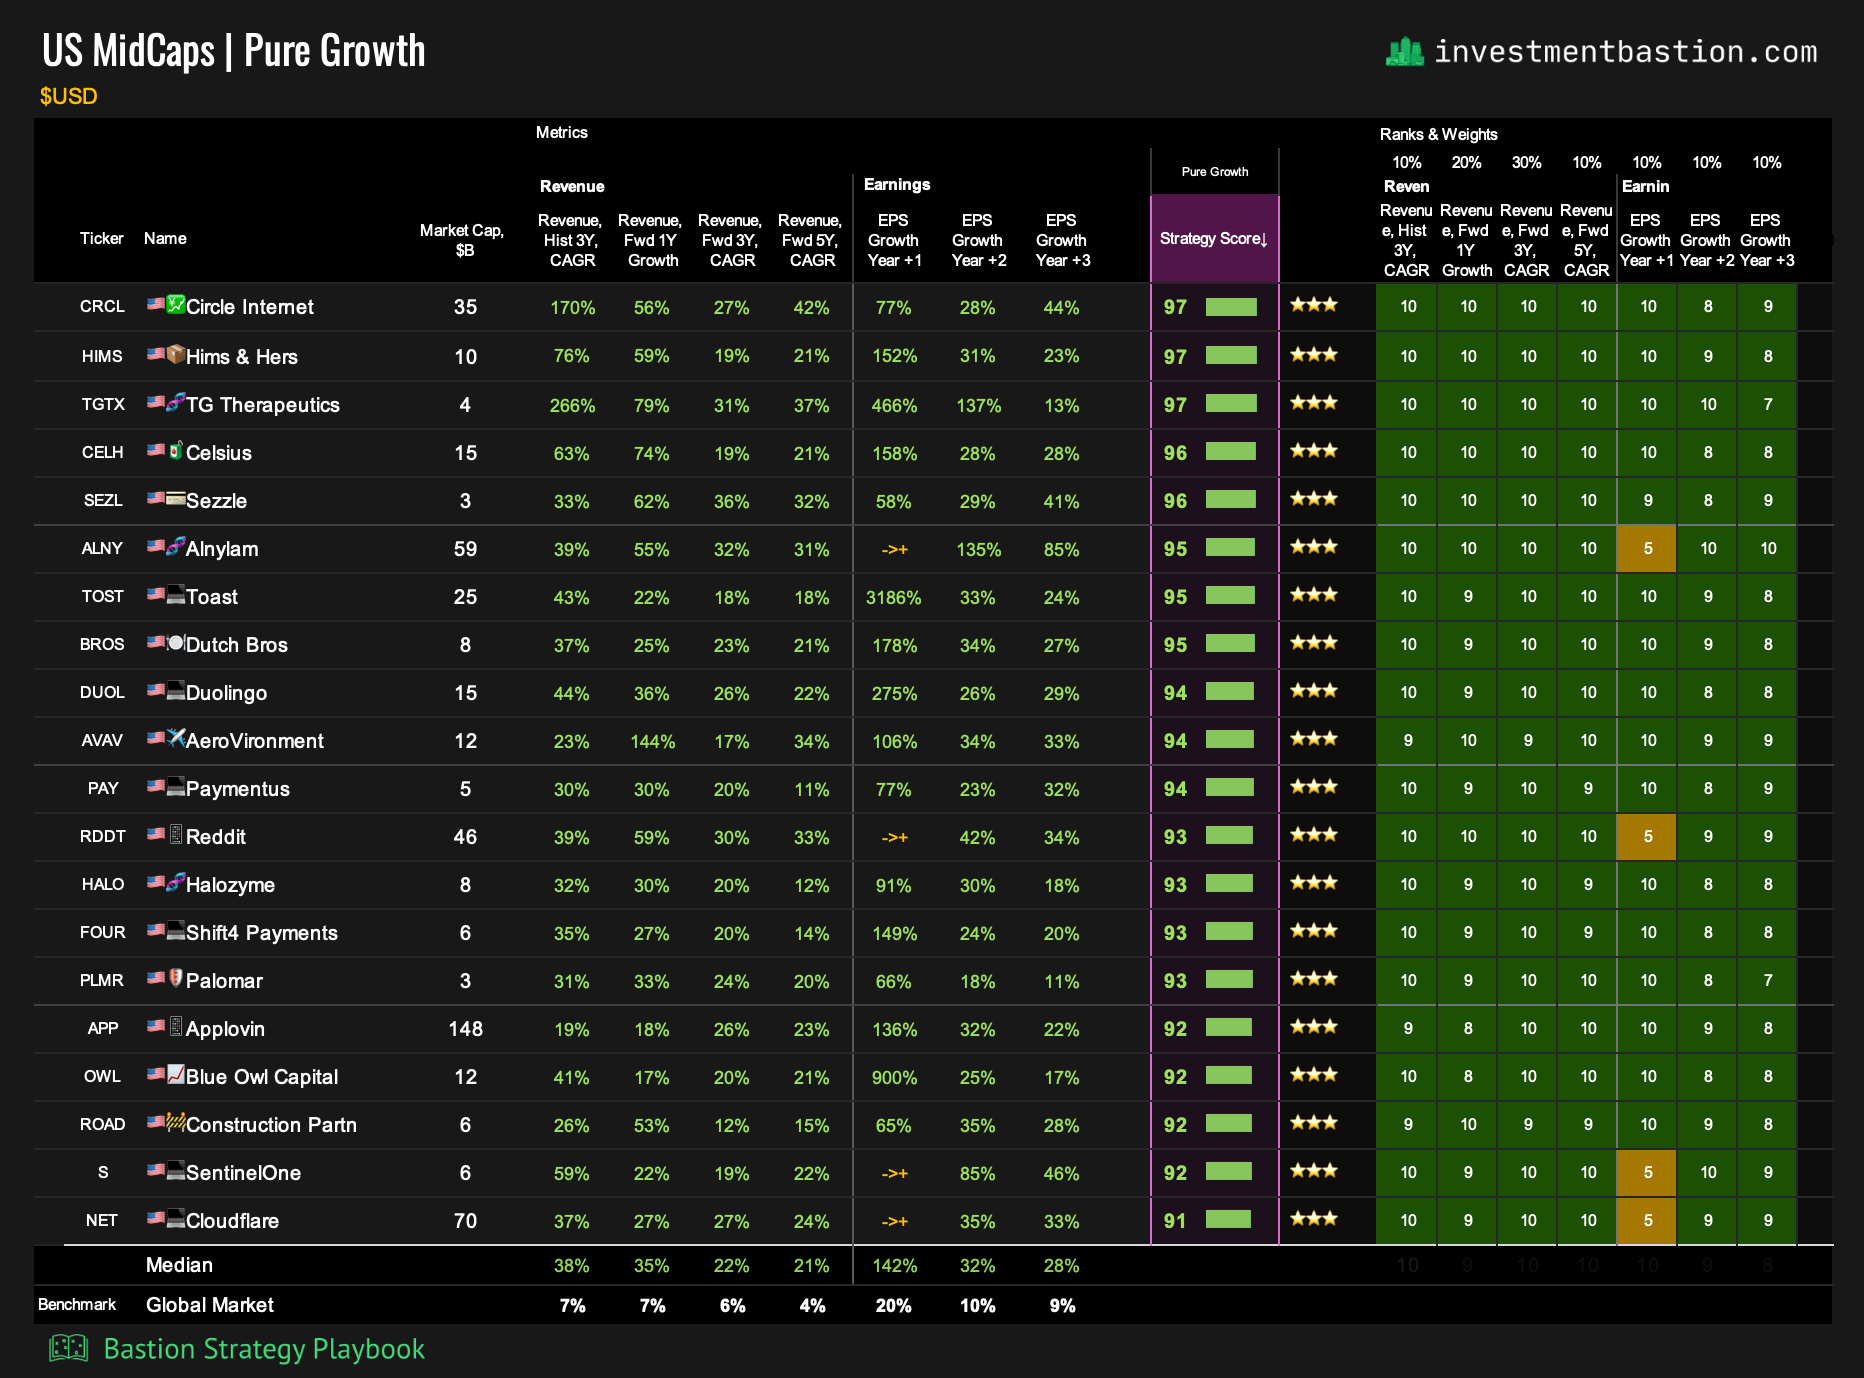
US Midcaps
Commentary
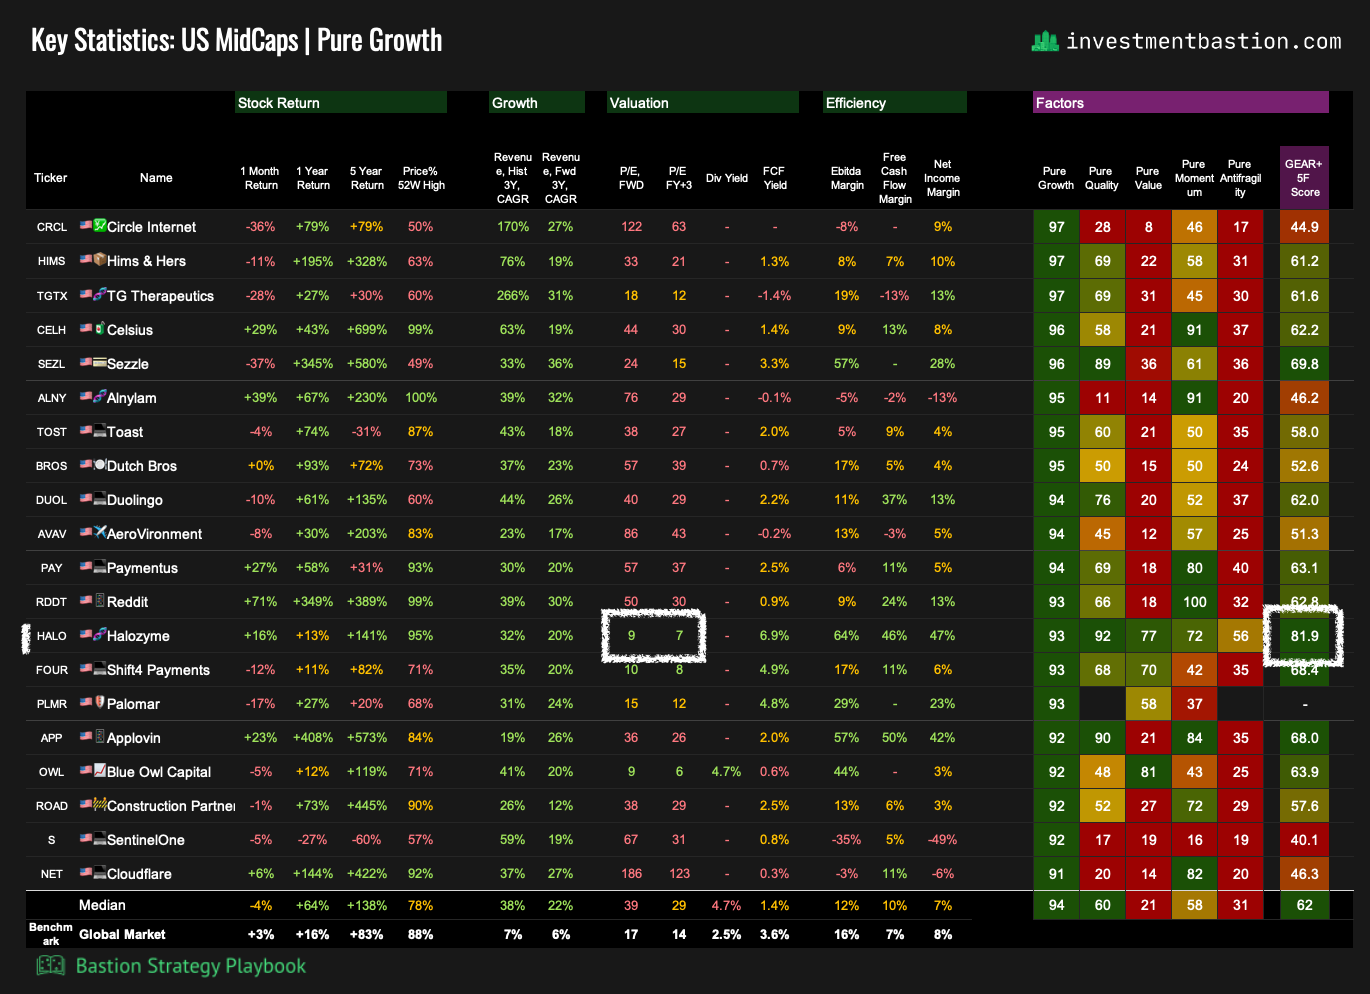
One standout here is Halozyme, which not only scores highly on the Growth ranking but also ranks among the top names on the multifactor GEAR+ score that incorporates value, momentum, and other parameters. Halozyme is a biotech company that developed a drug delivery technology called ENHANZE®, which enables many medicines to be administered quickly and conveniently as a simple subcutaneous injection. This saves patients time and effort while also simplifying procedures for healthcare providers.
Halozyme does not sell its own drugs but instead licenses this technology to major pharmaceutical companies (Roche, Pfizer, Johnson & Johnson, Takeda, among others). These companies integrate ENHANZE into their treatments and pay Halozyme royalties based on sales.
The combination of a stellar multifactor score and excellent growth makes Halozyme highly attractive. However, investors should note that many of the company’s licensing agreements expire after 2030, which could result in a decline in revenues if not offset by new partnerships.
US Dividend Aristocrats
This is an ideal dashboard if you are looking for dividend + growth stocks.
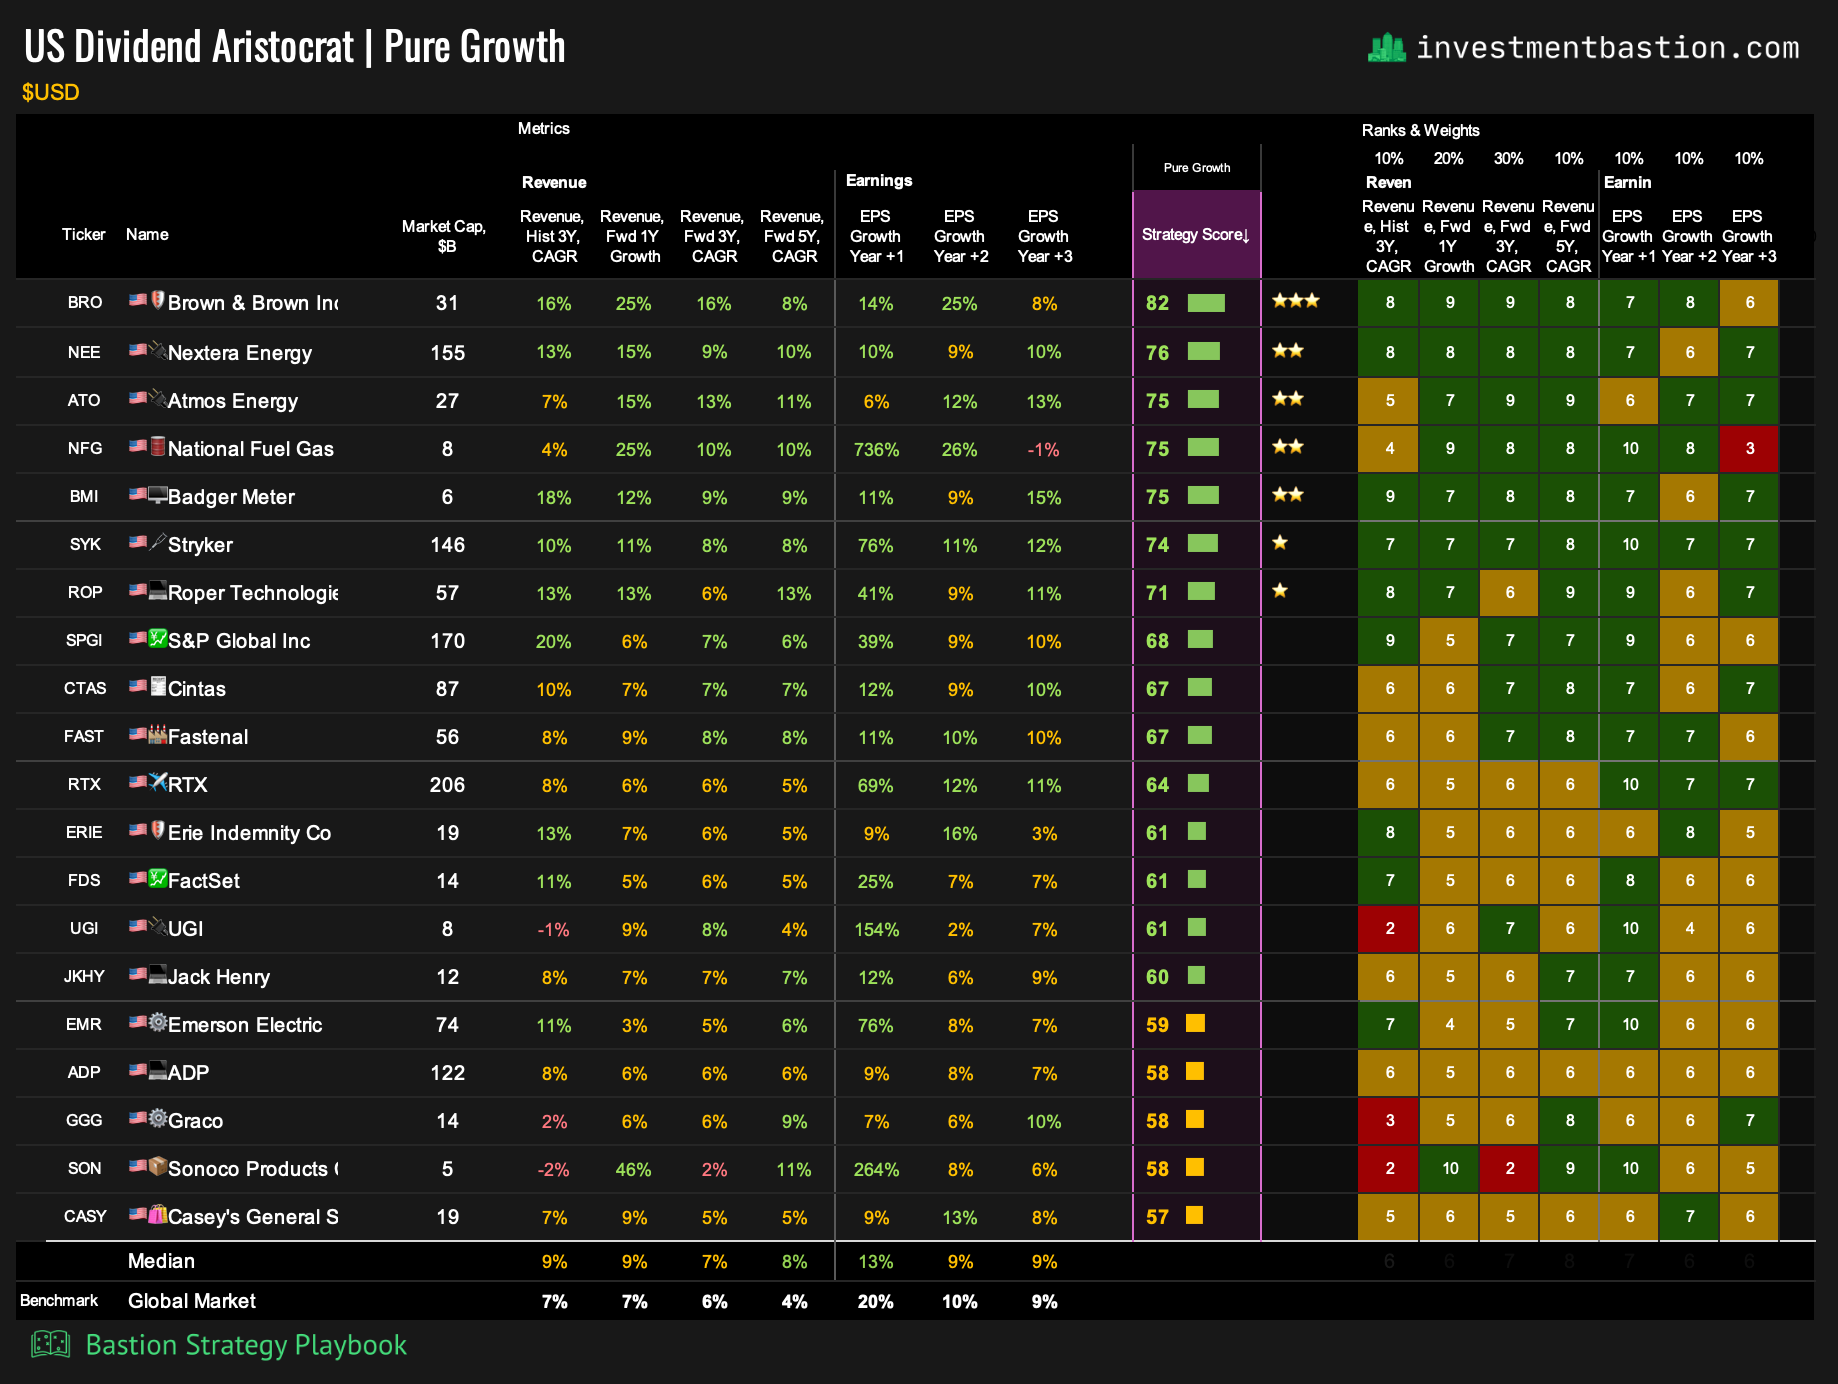
Commentary
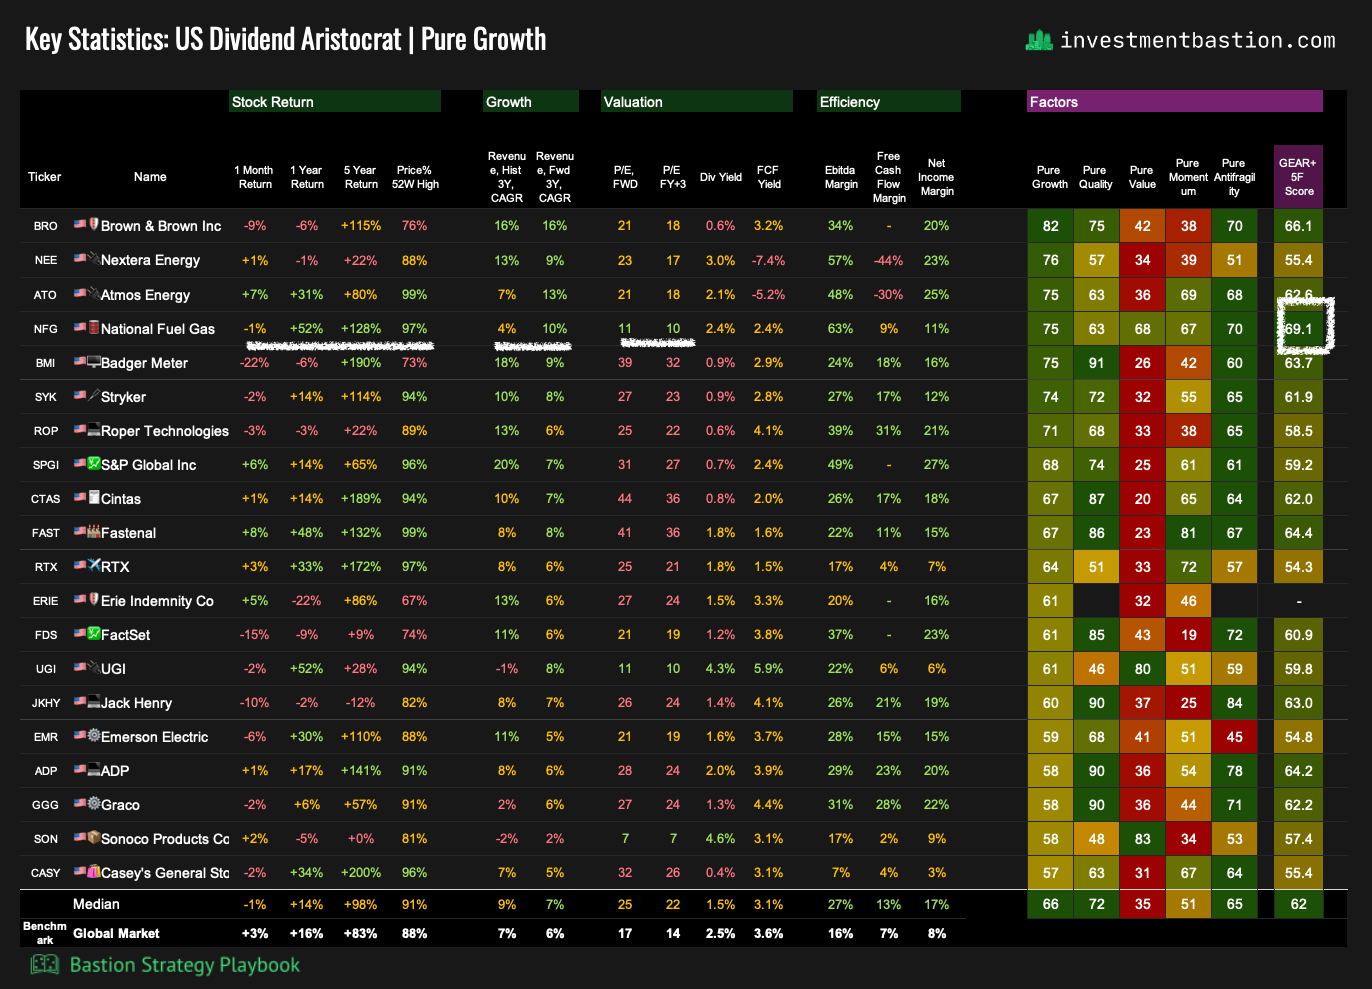
Among dividend aristocrats with growth potential, National Fuel Gas stands out. This vertically integrated natural gas company is expanding production and building new pipelines — Shippingport (2025) and Tioga Pathway (2026) — while trading at just 10x forward earnings. It offers a compelling mix of growth, quality, and valuation.
Europe 500 – Top Growth Companies in Europe
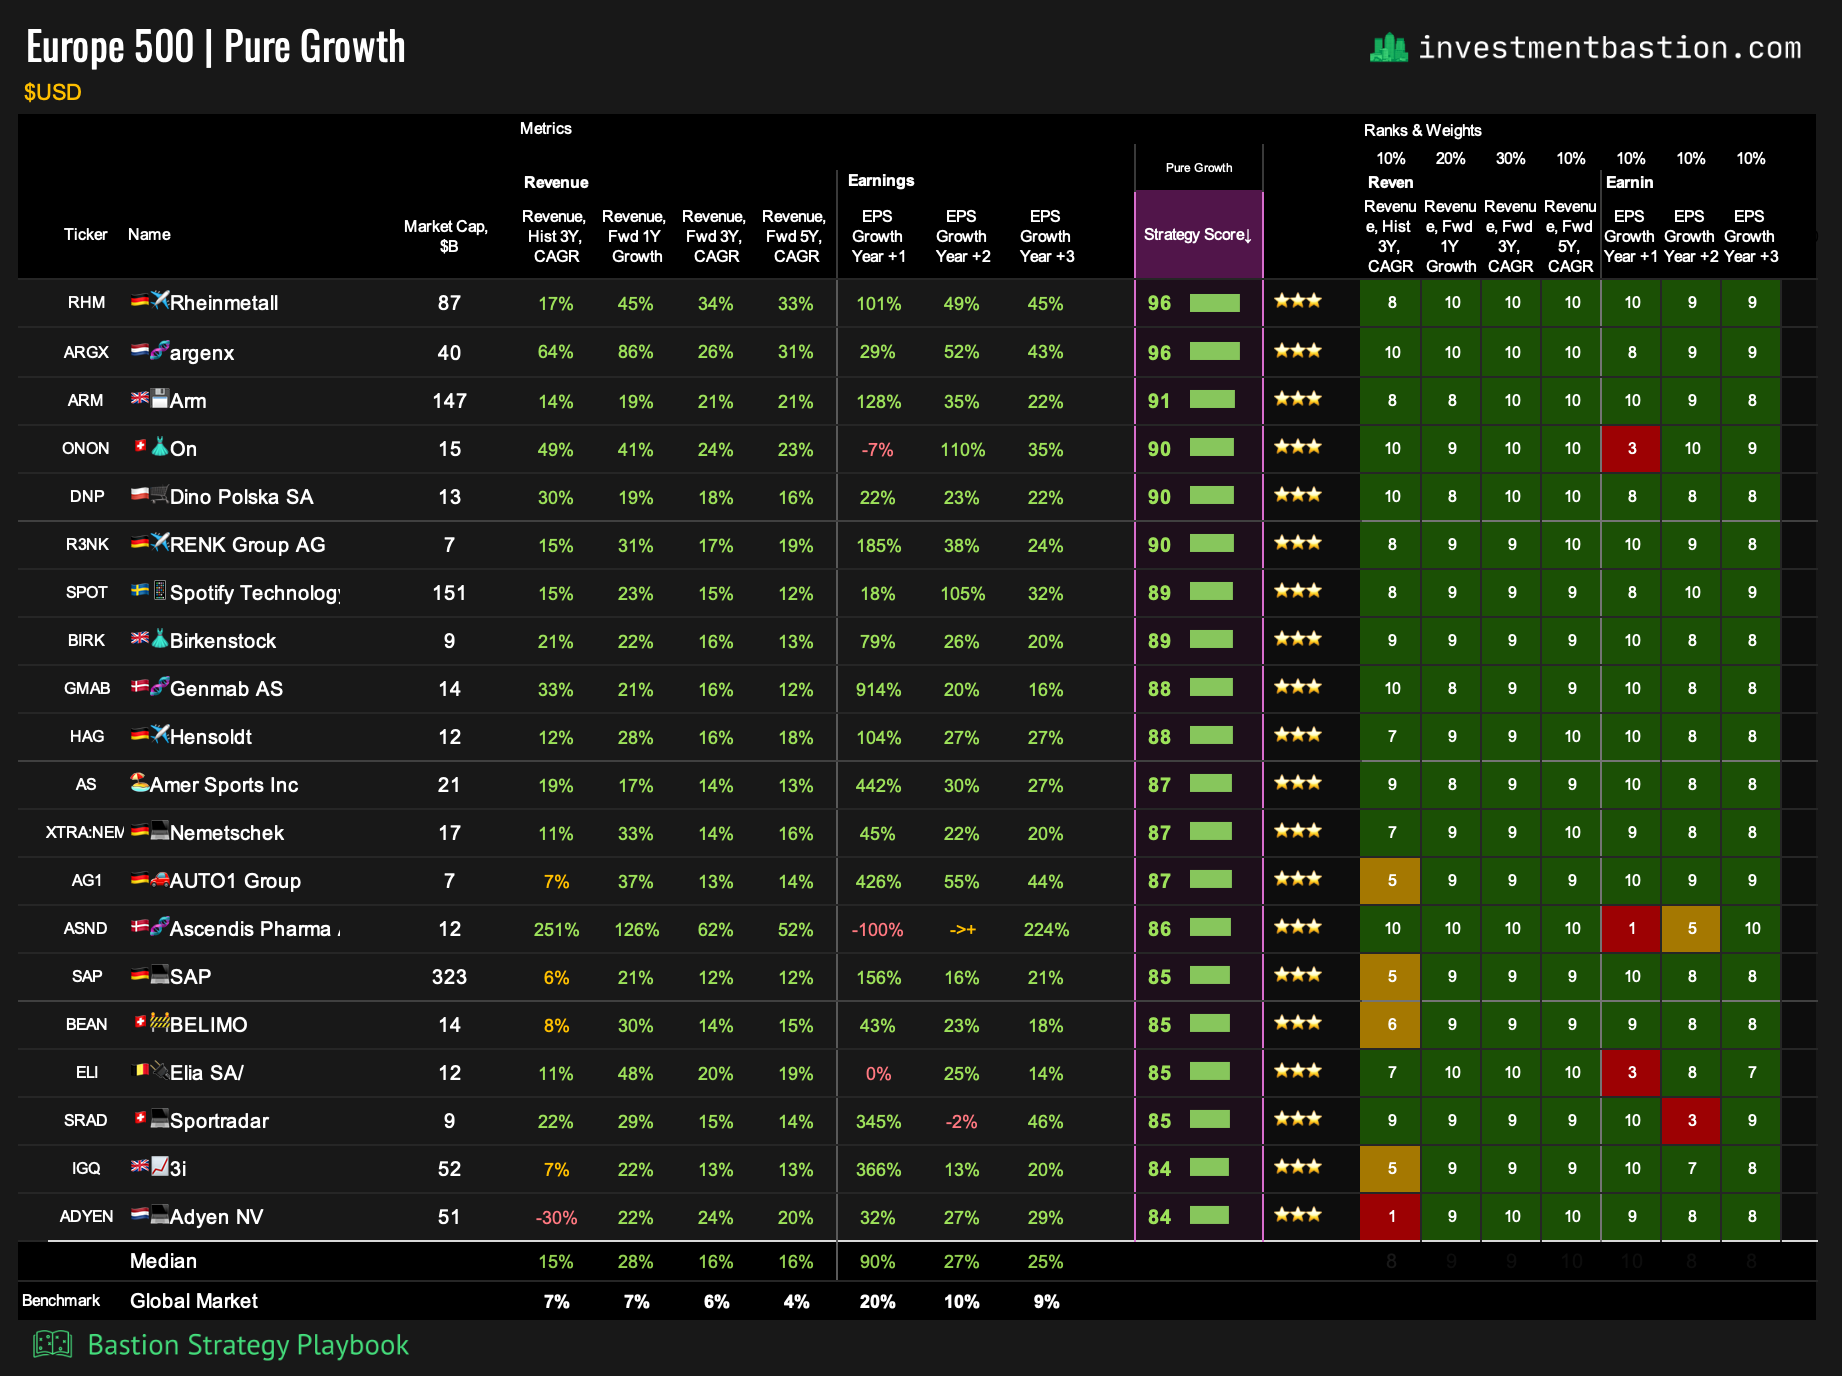
Commentary
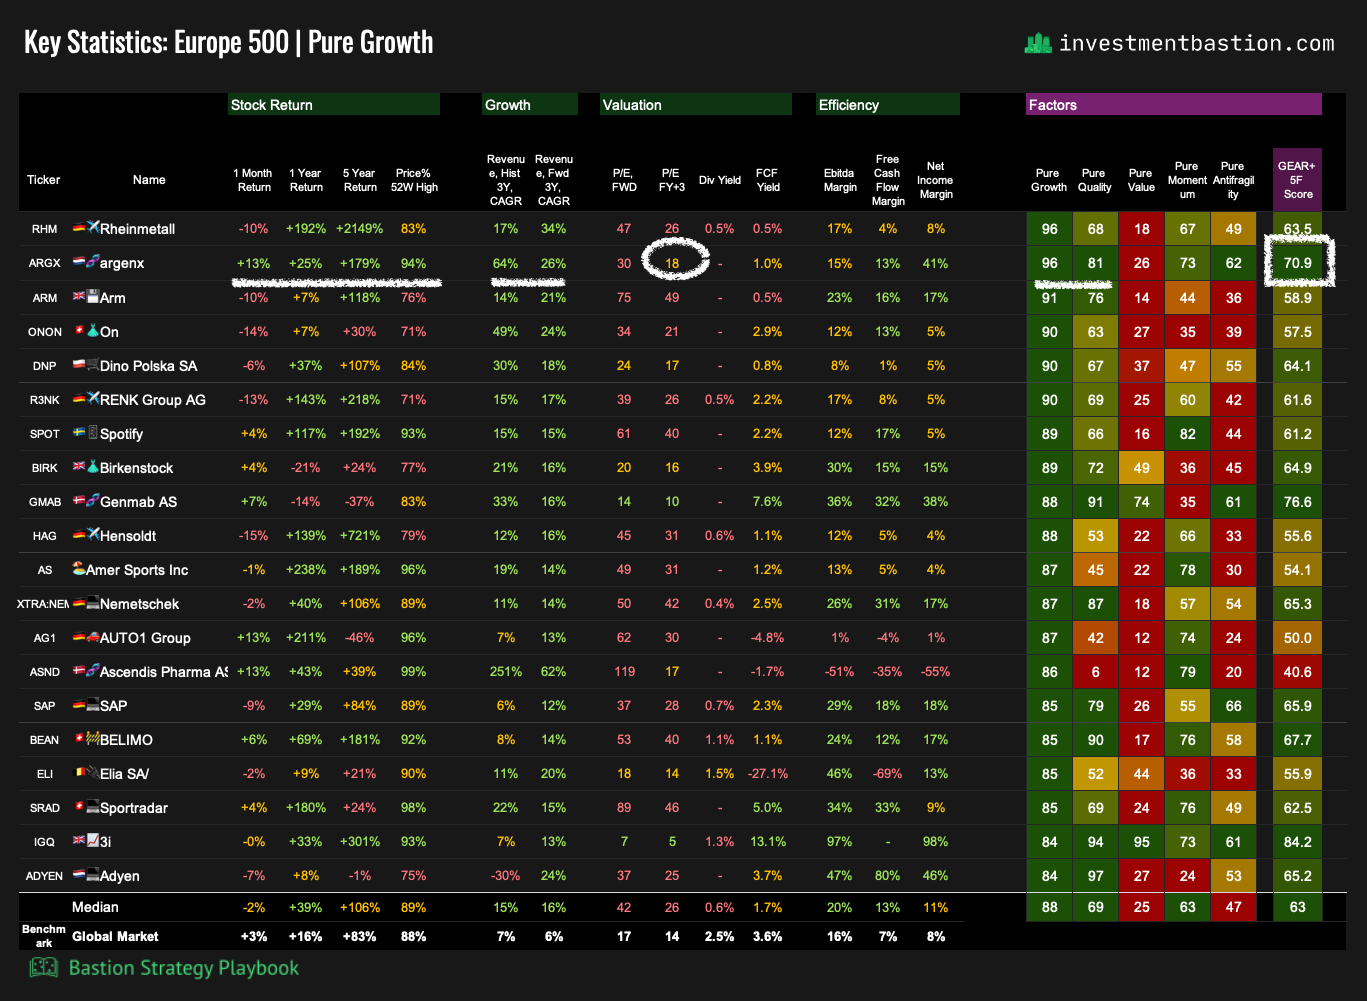
Dutch biotech Argenx stands out with its drug VYVGART HYTRULO, designed to treat a rare neurological disorder known as CIDP (chronic inflammatory demyelinating polyneuropathy). The company’s earnings are expected to triple by 2027, reaching more than $2 billion, while revenue is projected to grow by nearly 70%. The stock combines a reasonable valuation with strong share price momentum.
Ex-USA 500 – Top Large-Cap Growth Stocks Outside the US
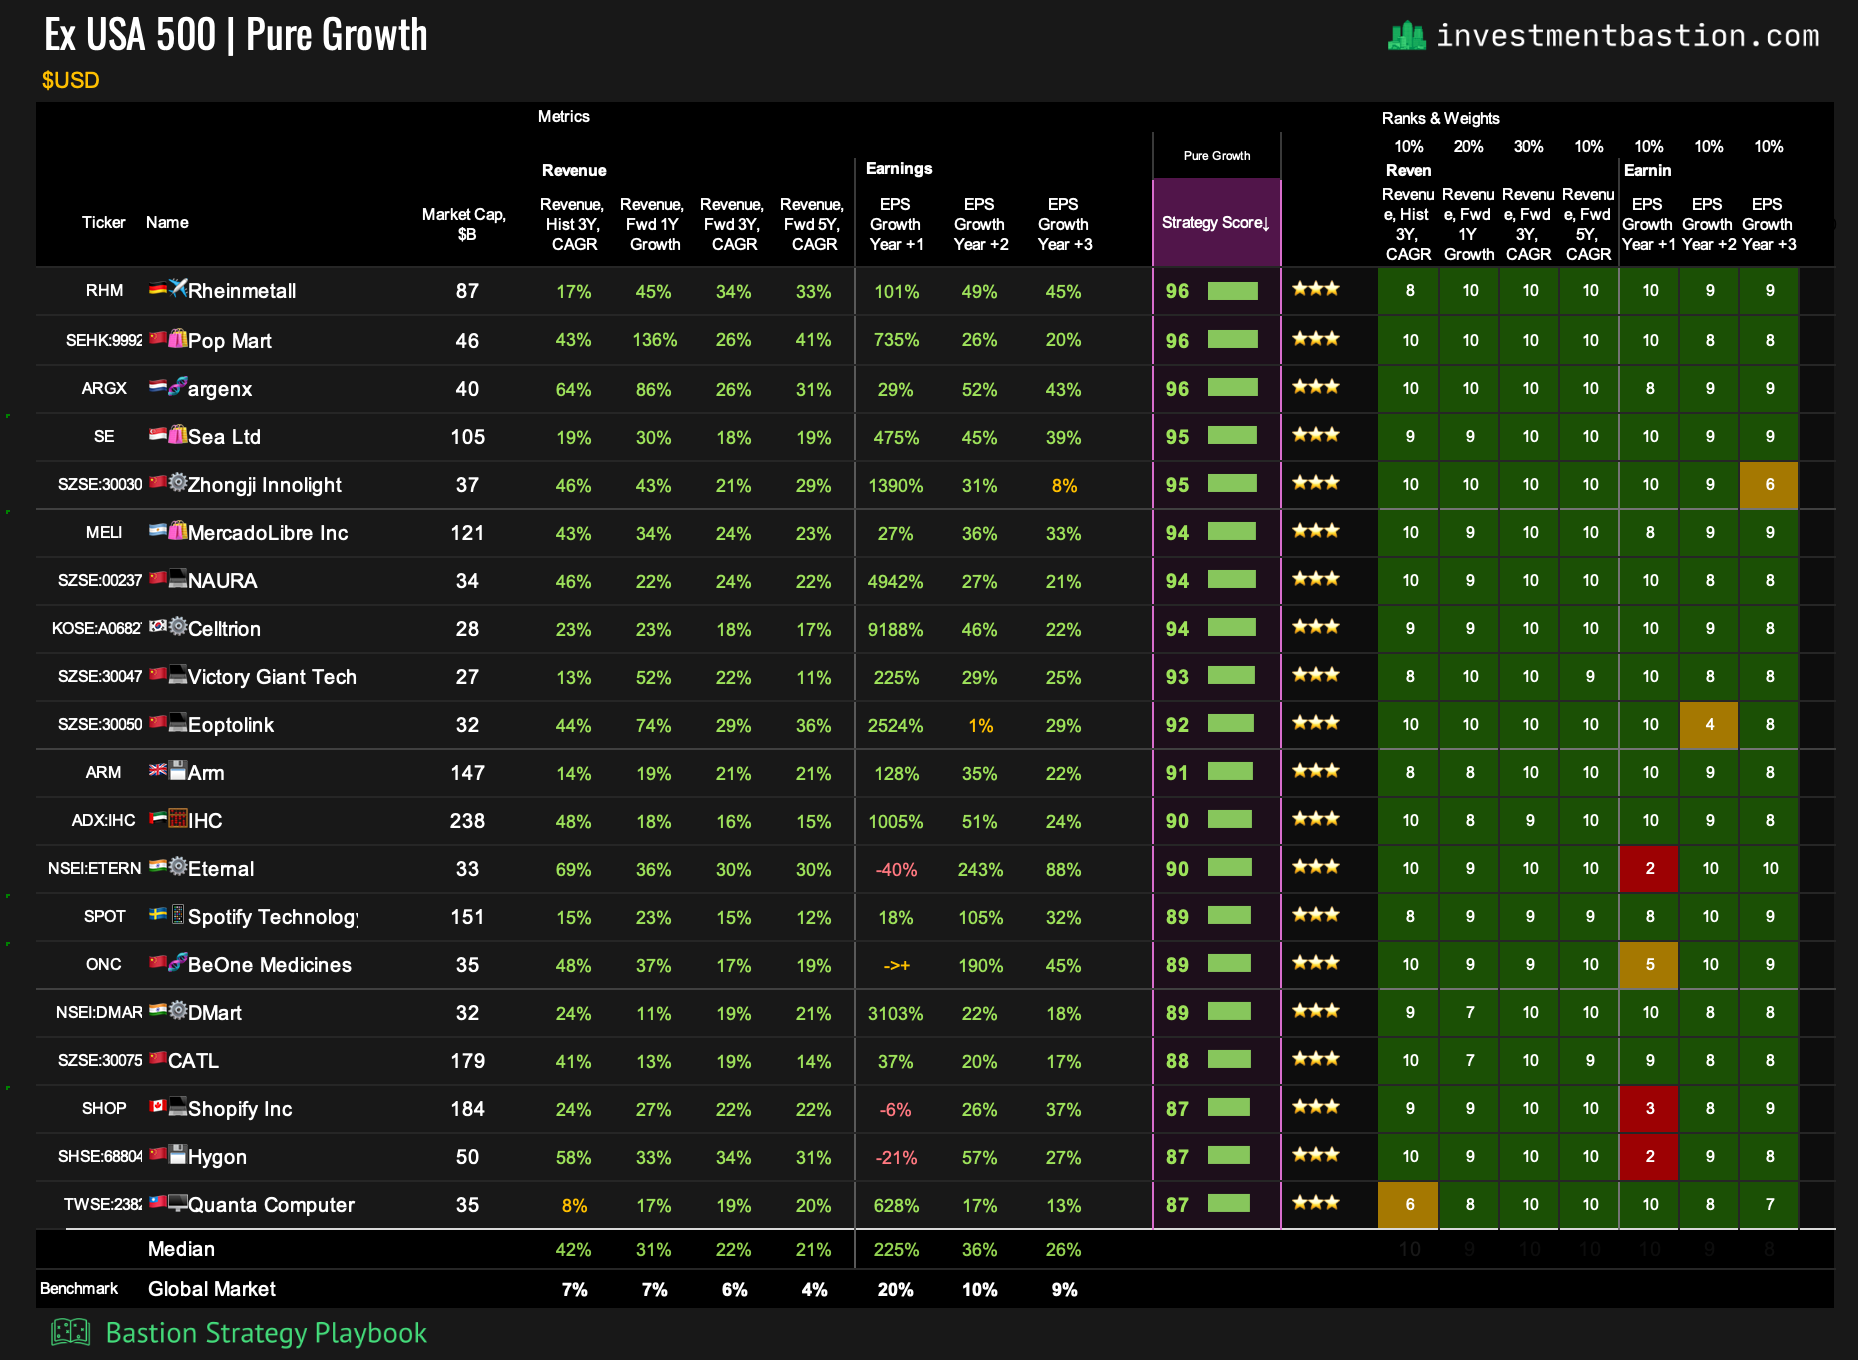
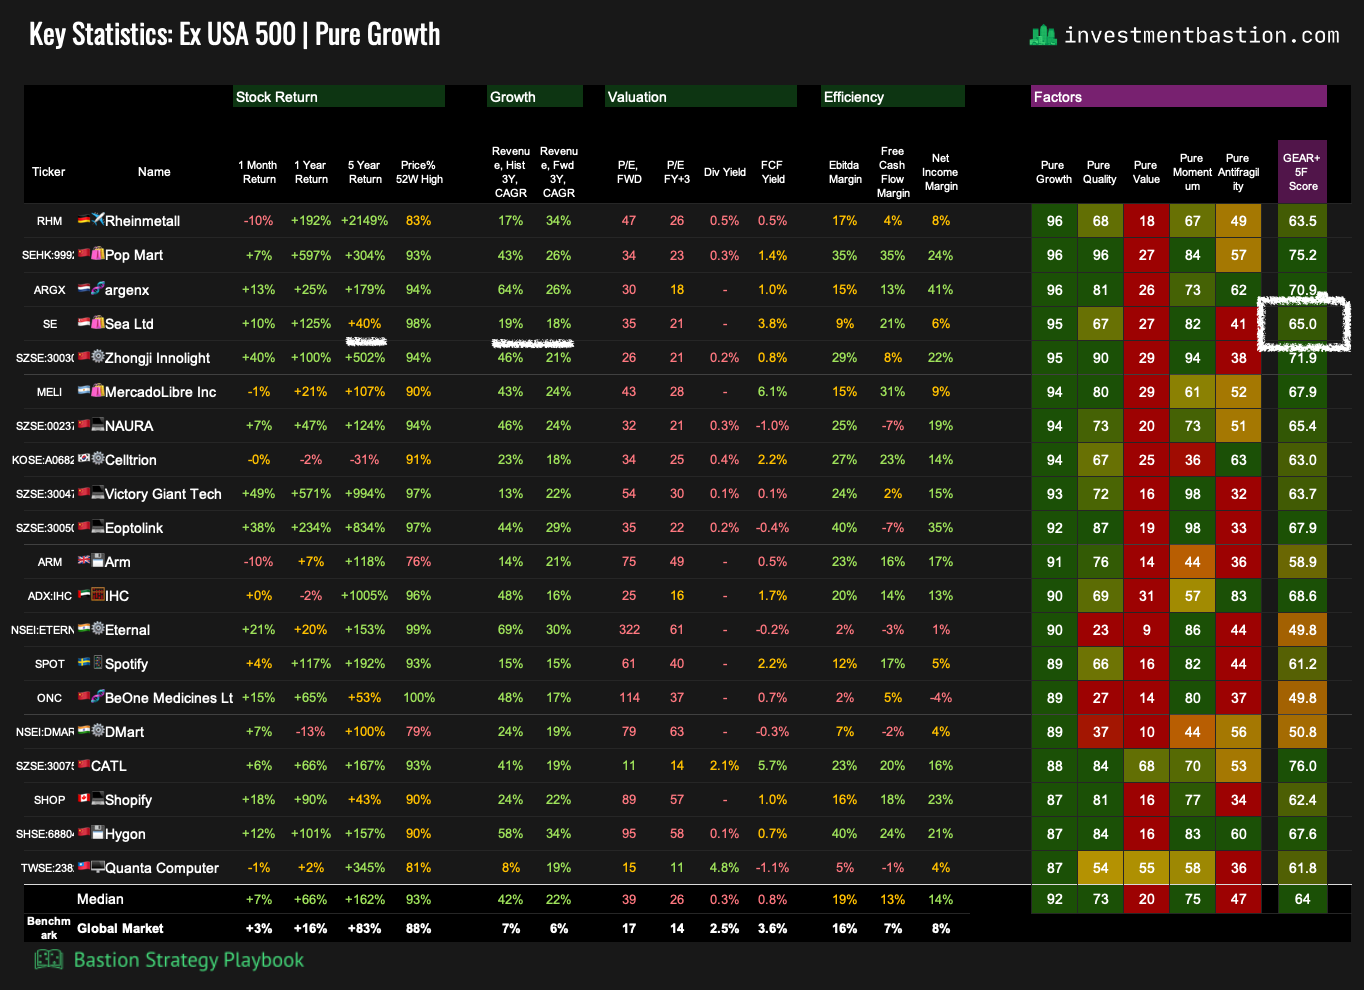
Commentary
One notable name is Sea Limited, a major technology company based in Singapore. It operates Shopee, the largest e-commerce platform in Southeast Asia, SeaMoney, its digital payments business, and Garena, a leading online games developer. The company is expected to deliver growth of nearly 20%, with a 2027 P/E ratio around 21x. The stock still trades at roughly half of its 2021 peak levels.
5. Growth Strategy in the Strategy Playbook
You can track Growth strategy leaders across regions, sectors, and stock lists in the Strategy Playbook file.
In the weekly Investment Strategy Playbook update, I also publish a dashboard with ratings and key statistics for S&P 500 and US mid-cap companies.
How can this be applied?
Build a systematic growth portfolio. Select a region, sector, or stock universe and construct a portfolio of 15–20 top-rated Growth leaders, rebalancing quarterly or annually. This creates a focused pool of the strongest growth stocks.
Complement other strategies. Use the Key Statistics dashboard to identify individual names that fit into portfolios driven by other factors (e.g., Quality, Value, or Dividend Growth), while still considering Growth as an additional driver.
Monitor trends and generate insights. Leverage the Growth dashboard with its extended statistics to track broader market dynamics, spot shifts in leadership, and form analytical conclusions.
In short, the Growth ratings can serve both as a foundation for dedicated portfolios and as a flexible overlay for enhancing multi-factor investment approaches.