


👉🖥️ Bastion Excel Terminal
The Strategy Builder is one of the most powerful tools for finding investment ideas. It helps you monitor global stock trends, compare companies across various metrics, and quickly identify stocks that best fit specific strategies.
The database currently includes around 3,000 companies: 1,400 from the U.S. and 1,600 from the rest of the world. New stocks are added periodically.
Next, I will explain the core features of The Strategy Builder.
1. Strategy Builder Tab

This is the core of the Strategy Builder. Using filters, the analyst defines:
Which strategy to apply (or create a custom one)
Which list to screen (e.g. S&P 500 companies)
Which country or global universe
Which sector(s) to include or exclude
Which metric to sort by
And finally, which filters to apply
Let’s look at each setting in more detail:
1. Strategy Selection
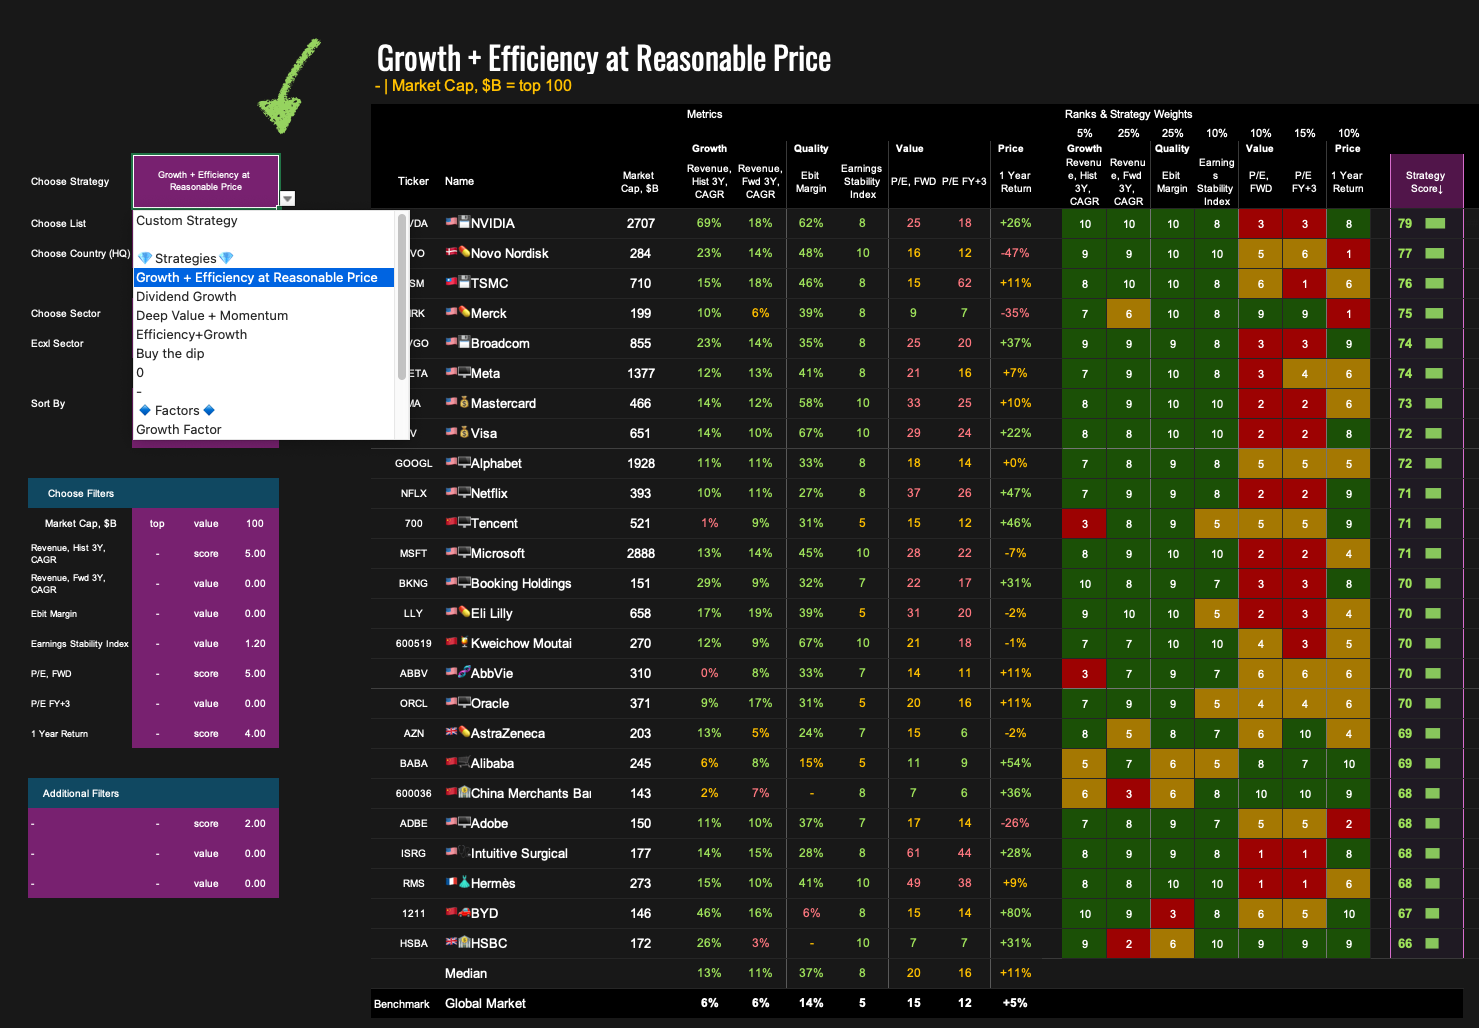
Currently, the terminal provides strategy ratings for four multi-factor strategies and five individual factors. Each strategy will be explained in a separate guide. Here's a quick summary:
Strategies
Growth + Efficiency at Reasonable Price (GEAR+)
High score = strong growth + operational efficiency + reasonable valuationDividend Growth
High score = relatively high dividend yield, positive free cash flow, and growing revenueDeep Value + Momentum
High score = attractive valuation combined with positive price momentumEfficiency + Growth
High score = fast-growing companies with high operational efficiency
Factors
Growth Factor
High score = strong growth in both revenue and earningsQuality Factor
High score = high margins, strong ROE, consistent profitability, and low debtDeep Value Factor
High score = low valuation multiples and high cash flow yieldShort-Term FOMO Momentum
High score = short-term price momentum, high volatility, and rising volumeStock Return
High score = combination of strong short- and long-term returns
Each strategy includes 7 weighted metrics. Each individual metric is rated from 1 to 10 based on the company’s relative rank. For example, a score of 10 in P/E means the company is among the cheapest 10%, while a score of 1 indicates it's among the most expensive.
Note: A high or low strategy score doesn't mean a company is "good" or "bad" — it simply shows how well the company fits the selected strategy profile.
2. Choose a List
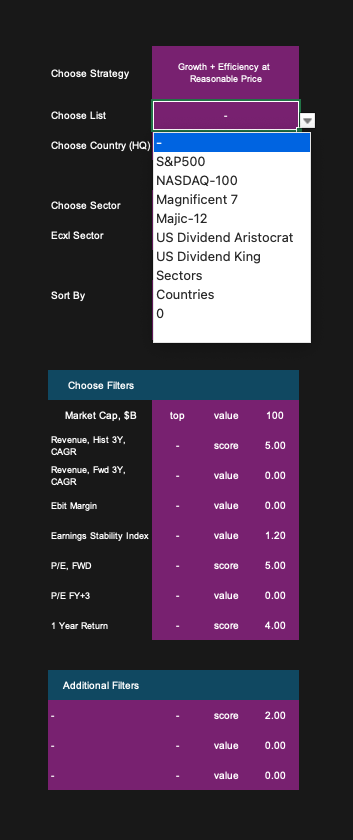
Select a predefined list of stocks — e.g., S&P 500, Nasdaq, Dividend Aristocrats, etc. You can combine this with other filters (e.g., S&P 500 + Tech Sector). Leaving it blank disables this filter.
3. Country Selection

You can select a specific country, a region (e.g., Europe), or “Ex-US”. The company’s country is typically where its headquarters are located. In some cases, economic relevance takes precedence — for example, PDD is listed under Ireland but categorised according to its core operations (China).
4. Sector Selection

Select from broad sectors (10) or more specific industries (~30). You can also use the Exclude Sector option to filter out particular sectors.
5. Sorting

Once the list is filtered, you can sort it by any strategy score or additional metric in the extended data tables. You can choose ascending or descending order.
6. Filters

Apply filters (if necessary) for:
Market Cap (set minimum/maximum in $bn, or use Top 50/100/500 options)
Strategy Parameters (filter by value or score — e.g., min Score = 5 for revenue growth will return companies with above-average expected revenue growth)
3 Additional Custom Filters beyond those used in the base strategy
Additional Tables


To the right of the main table, you’ll find extended tables with extra metrics and strategy scores, allowing for quick comparisons and deeper analysis.
Custom Strategy
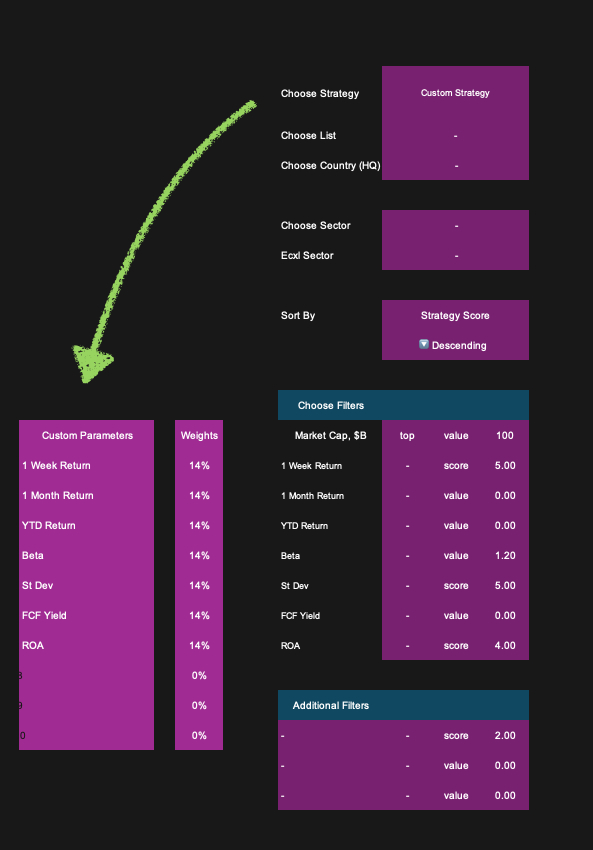
Select “Custom Strategy” to open a panel where you can choose your own metrics and assign custom weights — build a strategy tailored to your unique investment approach.
Key Stats Tab

On the Key Stats tab, you can review a broader set of statistics for the selected stock, including its industry, sector, and market capitalisation. This can help you understand what filters to apply to build a list that includes this stock.
If you want access to these dashboards, subscribe below.
Other Guides: