
Bastion Stock Valuation Strategies
The stock selection and investment idea generation system by Bastion.

👉🖥️ Bastion Excel Terminal
Contents
1. What Is the Scoring Method?
2. Scoring vs. Traditional Valuation Methods
3. Two Core Portfolio Strategies
4. Two Alternative Portfolio Strategies
5. Additional Scoring Models
1. What Is the Scoring Method?
Investment Bastion uses a revolutionary approach to equity valuation and active portfolio management based on a proprietary scoring system.
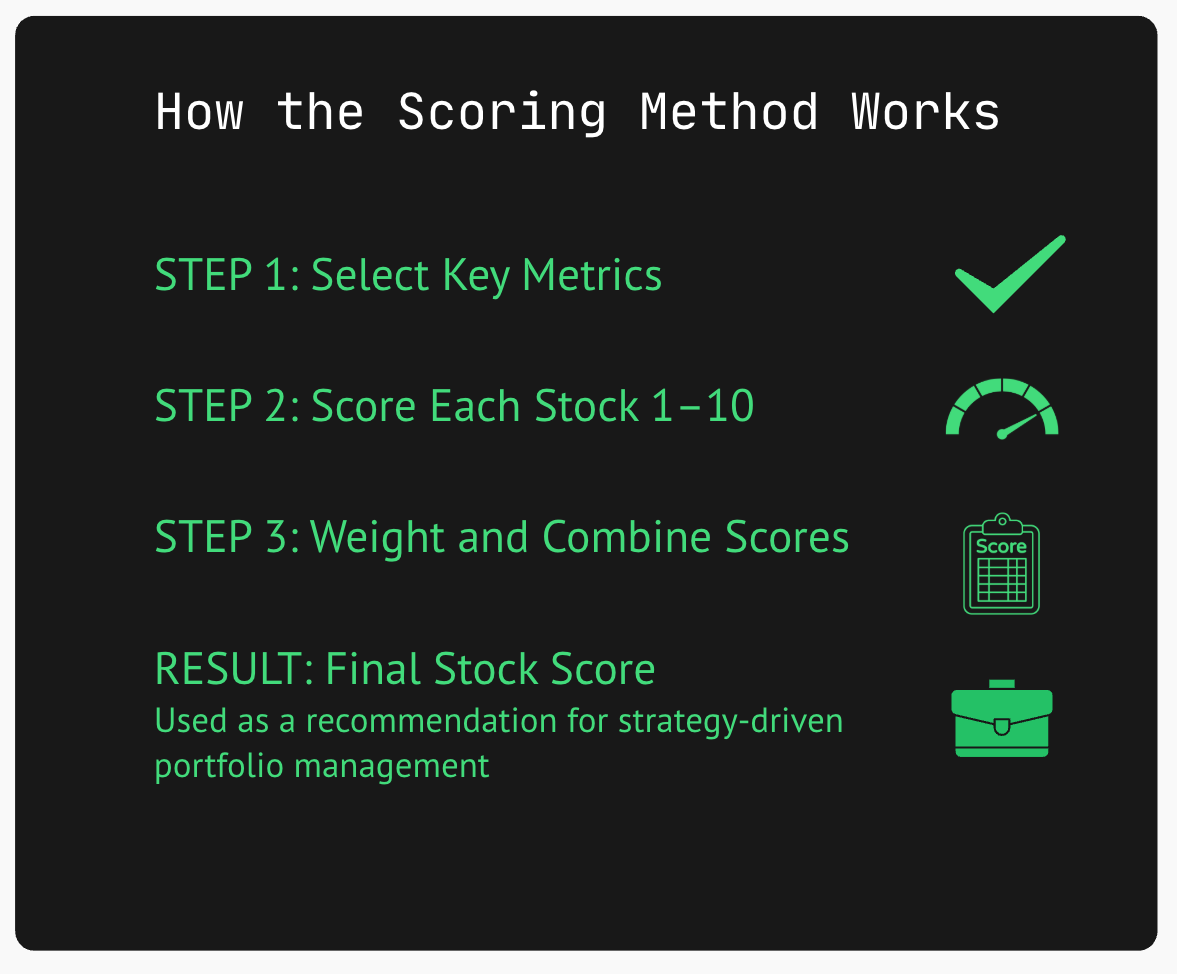
Here’s how it works, in simple terms:
Key metrics are selected depending on the strategy — these may include valuation ratios, dividend yield, debt levels, and more.
Each stock receives a score from 1 to 10 for every metric. A score of 10 means the stock is in the top 10% globally for that metric, 9 means top 20%, and so on.
Scores are then weighted and combined into a final composite rating.
This final rating shows how well a stock fits the strategy’s defined criteria.
Once calculated for the entire market, it becomes easy to identify the most attractive investment opportunities.
Currently, Bastion’s Strategy Builder analyzes:
Over 60 metrics
Across 10 distinct strategies
Covering nearly 4,000 stocks globally
These scores form the foundation for managing Bastion’s four proprietary investment portfolios.
This approach enables us to:
Deliver a fundamental, rules-based view of a stock’s potential
Screen and compare thousands of companies worldwide
Rapidly implement new strategy-driven ideas
2. Scoring vs. Traditional Valuation Methods
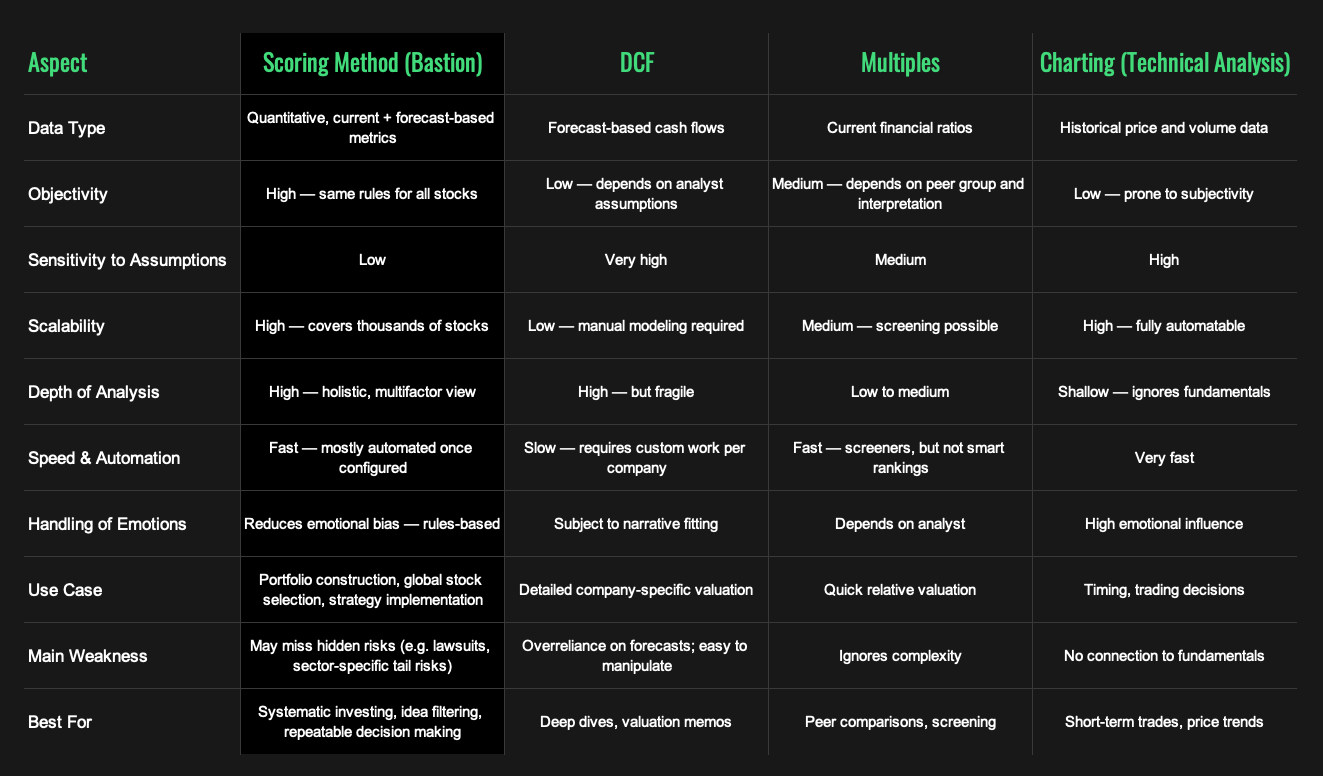
After spending nearly a decade working at a brokerage and an asset management firm, I became increasingly frustrated with the standard valuation methods widely used across the investment industry. Here’s why:
DCF (Discounted Cash Flow)
This method involves forecasting a company’s future cash flows and discounting them to the present using a discount rate that reflects the time value of money and risk. The result is an estimate of a stock’s intrinsic value, which is then compared to its current market price to determine the potential upside or downside.
Why it fails:
Extremely sensitive to assumptions:
Small changes in growth forecasts, margins, or the discount rate can lead to huge swings in the final valuation. For example, changing the long-term growth rate from +2% to +3% can flip the valuation from –10% downside to +20% upside. That makes no real-world sense and allows the analyst to “manipulate” target prices to fit a desired narrative. DCF often appears to be scientific precision, but in practice, it’s often built on subjective guesswork.Not scalable:
It’s impossible to build DCF models for hundreds of companies without a large team of analysts.
Valuation Based on Multiples
This is a more popular approach — comparing companies using metrics like P/E, EV/EBITDA, P/BV, dividend yield, etc.
The problems:
Used in isolation, multiples mislead:
A low P/E and high dividend yield can often mean the company is in decline. Revenues and profits may be falling, and the “cheap” stock keeps getting cheaper.No built-in way to weigh what matters most:
Even if you use a screen with dozens of filters, you can’t easily assign different importance to each metric, making your analysis shallow or inconsistent.
Technical Analysis (Chart-Based Investing)
Pure price-based analysis ignores fundamentals and is especially vulnerable to noise, emotion, and subjectivity. While it may help in timing, it is a weak foundation for long-term, fundamentally driven investing.
How the Scoring Method Solves These Problems
✅ Less subjectivity:
Unlike DCF, scoring is based on observable, up-to-date data: valuation ratios, balance sheet strength, dividend yield, analyst forecasts, and more. Every company is evaluated under the same objective rules — no room for “massaging” the outcome.
✅ More comprehensive and customisable:
Rather than rely on one or two metrics, scoring models combine many — each with its own assigned weight depending on the strategy. This allows for a holistic view of a company’s quality and investment potential.
✅ Automated selection:
Once set up, the system runs with minimal effort. Investors and analysts get a ready-made, ranked list of the most attractive stocks — no need to manually comb through tickers.
✅ Scalable to thousands of companies:
You don’t need to build a separate model for every business. The scoring approach allows for global, multi-sector analysis at scale — with consistent logic.
✅ Reduces emotional bias:
You follow a rule-based system, not market noise or gut feelings. That increases discipline and consistency in the investment process.
But Is It Perfect?
No system is. While I believe scoring is the best tool available for analysts and portfolio managers, it’s important to be aware of its limitations:
⚠️ Some inputs are based on forecasts — analyst estimates can be wrong. For example, in 2020, Intel had a high score under the Growth + Efficiency at Reasonable Price strategy. But market shifts — such as Nvidia’s rise in AI chips and Apple’s move to in-house silicon — caused Intel to lose market share and its stock to collapse.
⚠️ Risks may not be captured:
Johnson & Johnson may score well under a dividend strategy — yet still face massive legal liabilities from lawsuits. Such risks often aren’t visible in quantitative data.
⚠️ Sector concentration bias:
Without adjustments, scoring may favor certain sectors. For instance, banks often score high in value and efficiency strategies — but they face systemic risks that aren’t fully captured by standard metrics. The same applies to energy and commodity sectors, which tend to carry built-in “crisis discounts” that most valuation methods fail to reflect.
The Solution
Think of the scoring system as a starting point — a powerful idea filter, not a final decision engine.
From there, you can apply deeper case-by-case analysis, stress-testing individual companies for hidden risks or sector-specific issues.
Nothing stops you from combining the scoring model with other methods, whether qualitative analysis, macro context, or traditional valuation tools. But scoring provides the most efficient way to narrow the field and focus your energy where it matters most.
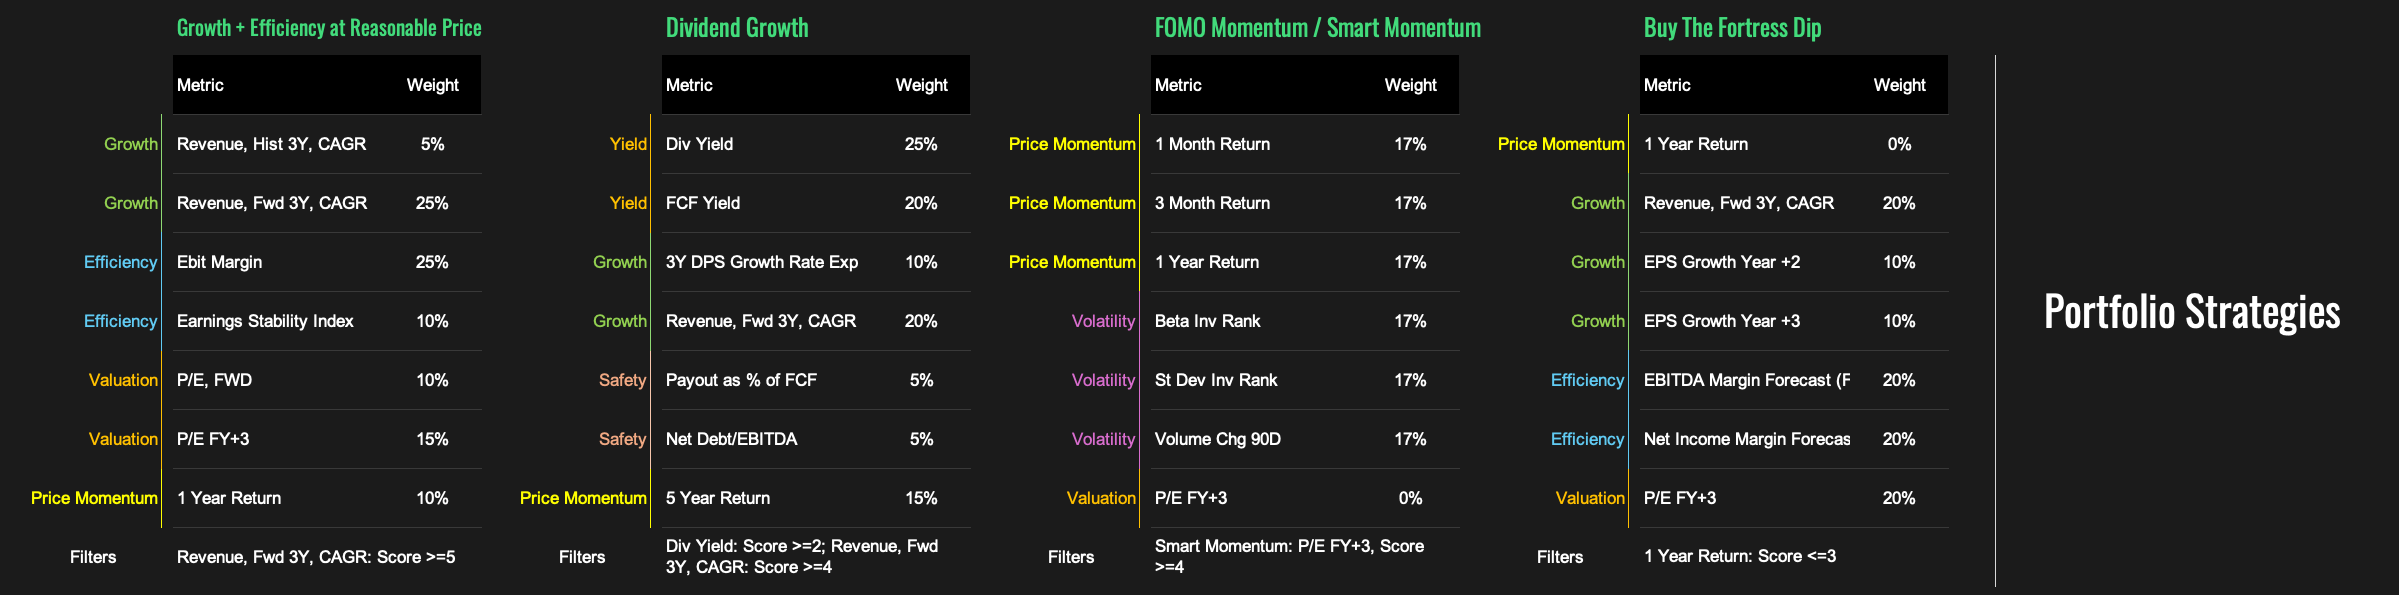
3. Two Core Portfolio Strategies
Now let’s take a closer look at how I actually use scoring models in practice.
Personally, I maintain four active equity portfolios, each driven by its own customized scoring system. Stocks with the highest scores are the top candidates for inclusion in these portfolios.
However, it's important to clarify:
- High scores do not guarantee automatic inclusion,
- Low scores do not mean automatic exclusion.
The scoring system serves as a recommendation engine, not a rigid rule. Every decision is further filtered through fundamental checks, sector nuances, and judgment.
Two Core Strategies I Rely On
Among the four strategies, two stand out as the core of my active investing philosophy:
Growth + Efficiency at Reasonable Price (GEAR+)
Dividend Growth
Why these two? Because they reflect how I personally approach investing:
I want to own high-quality businesses that are growing and operating efficiently.
But I don’t want to overpay for that growth.
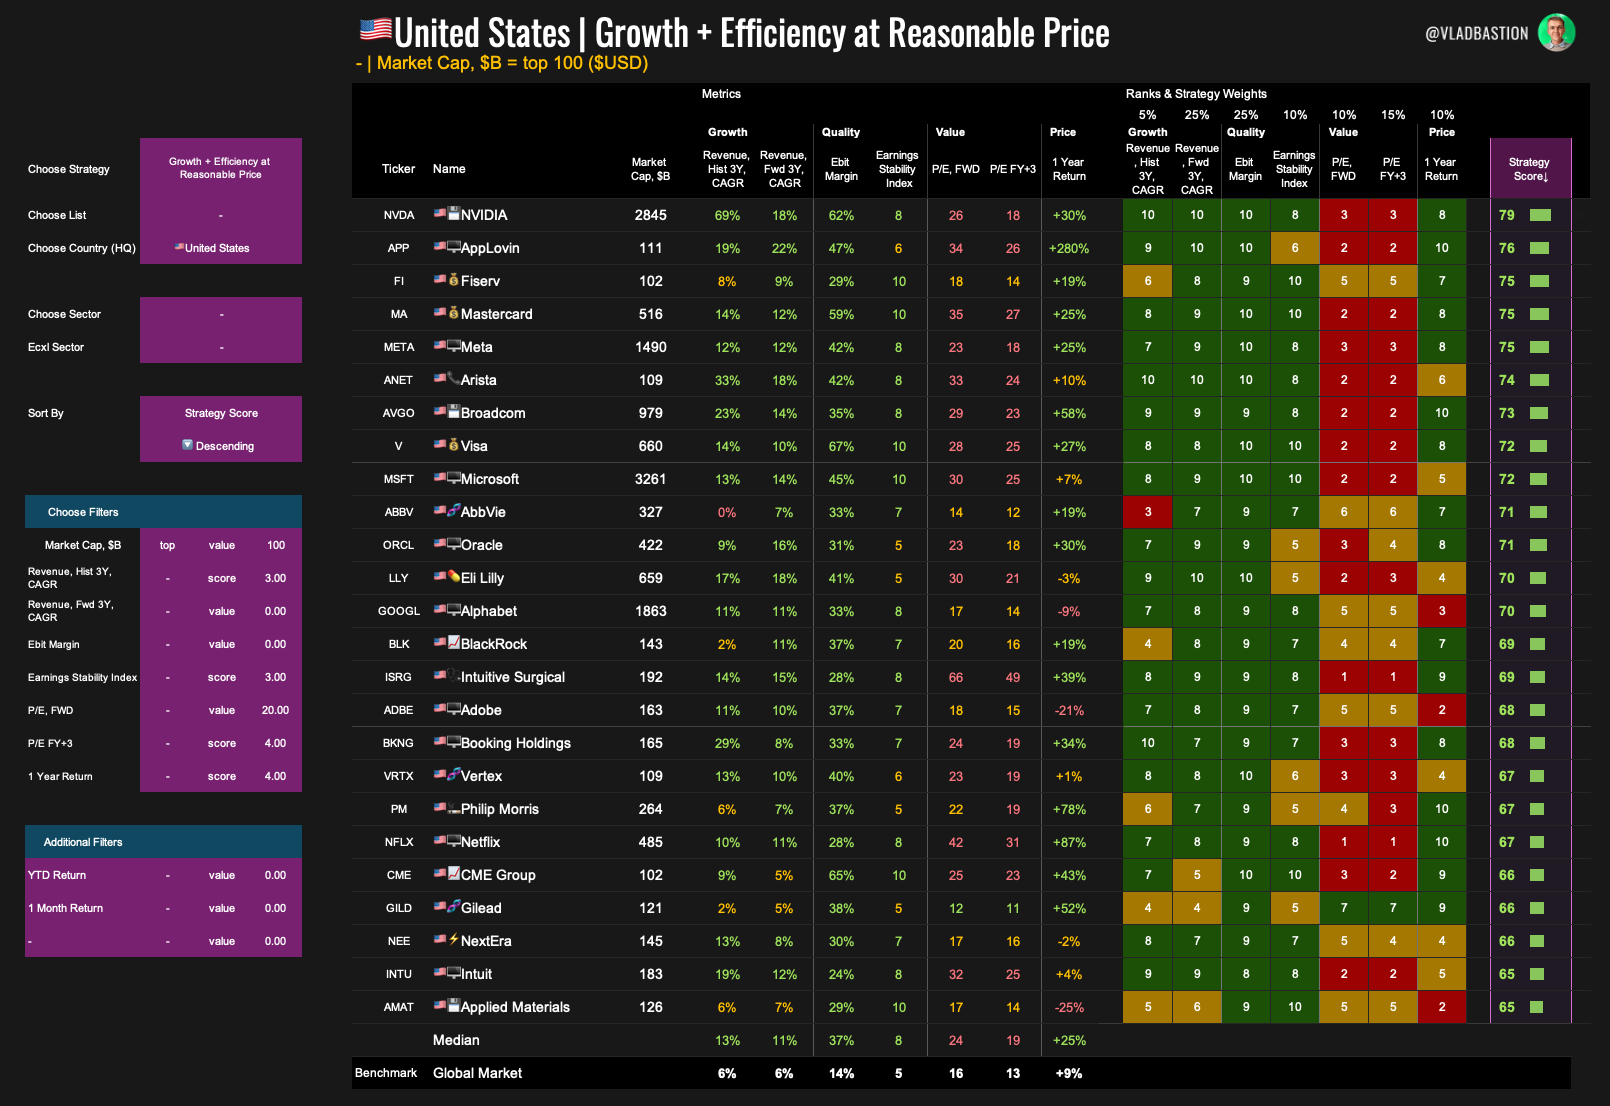
GEAR+ — Growth + Efficiency at Reasonable Price
Core idea:
Identify companies that are growing, operating efficiently, and still trading at a reasonable valuation.
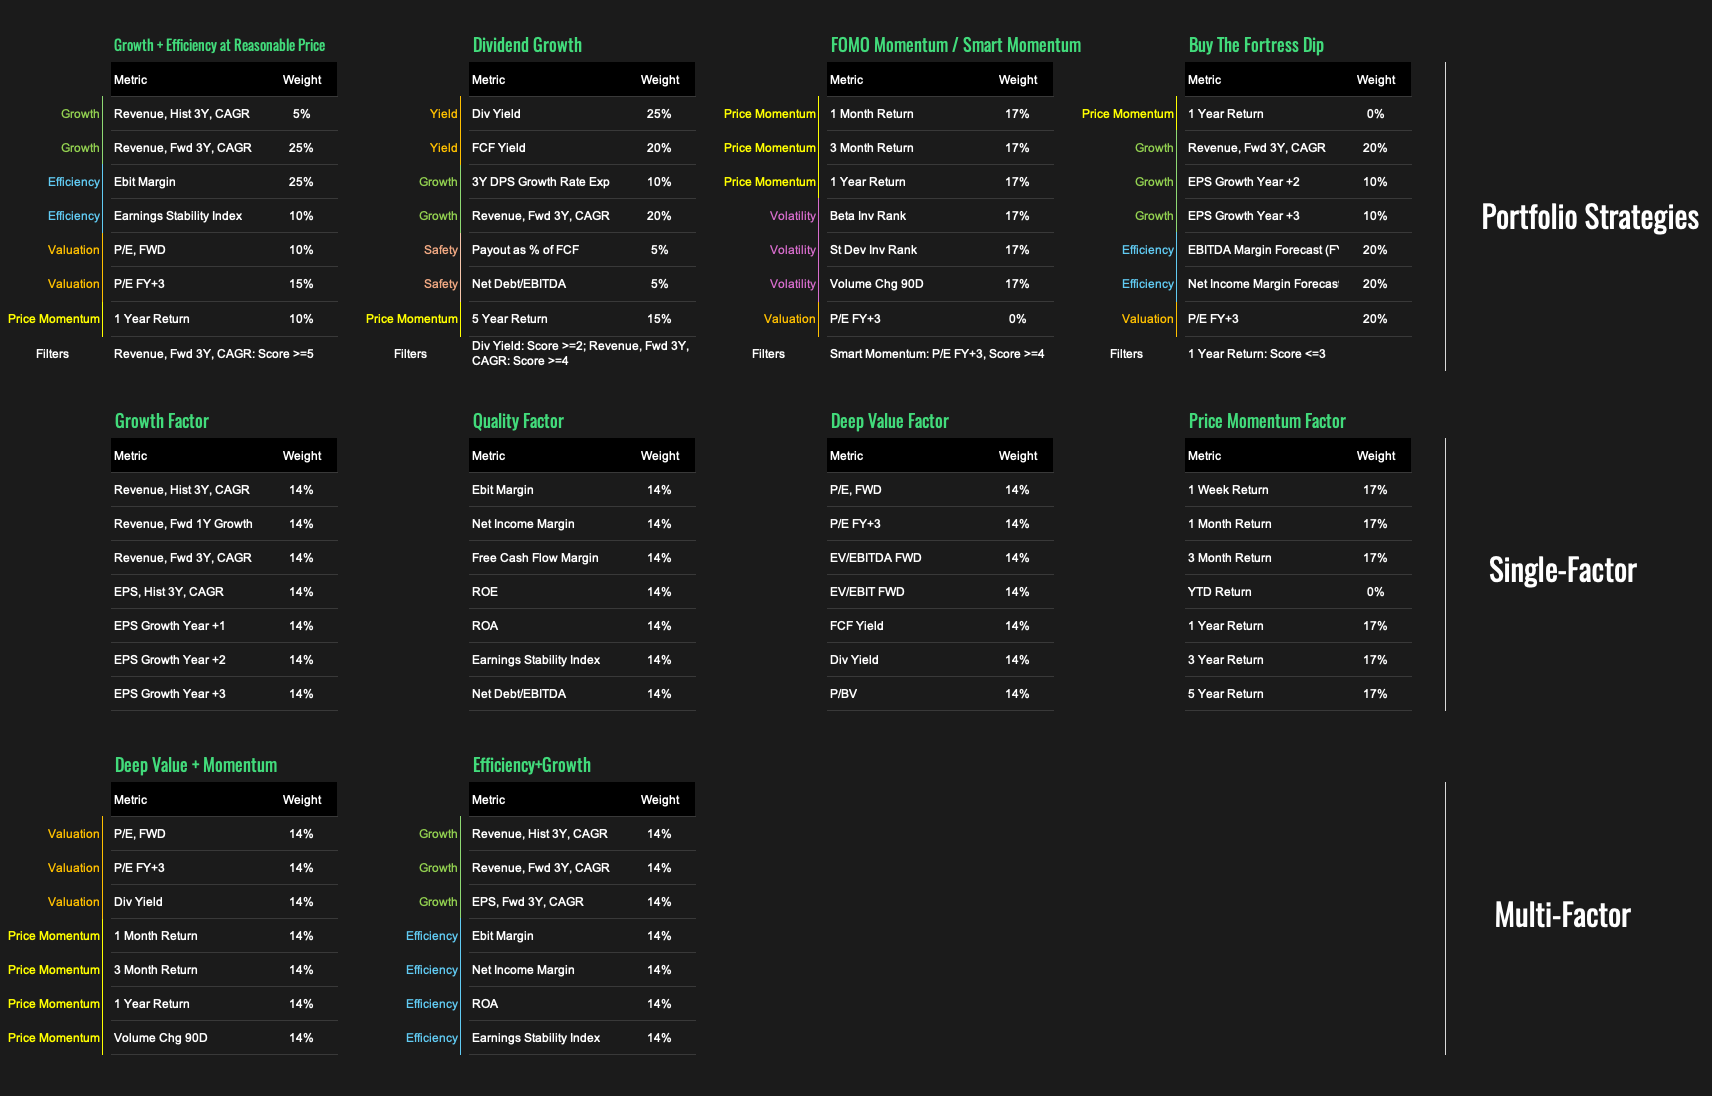
Metrics & Weights
Revenue, Hist 3Y CAGR – 5%
→ Historical revenue growth over the past 3 yearsRevenue, Fwd 3Y CAGR – 25%
→ Projected revenue growth for the next 3 years (based on analyst consensus)EBIT Margin – 25%
→ Operating efficiency: Earnings Before Interest and Taxes as a percentage of revenueEarnings Stability Index – 10%
→ Custom metric measuring consistency of EPS over 5 years (FY–3 to FY+1)P/E, Forward – 10%
→ Valuation multiple based on next year’s estimated earningsP/E, FY+3 – 15%
→ Valuation multiple based on earnings projected 3 years ahead1-Year Return – 10%
→ Total stock price return over the past 12 months
📌Additional filters for portfolio management:
Only companies with a Revenue Growth (Fwd 3Y) Score ≥ 5 are considered.
The higher the score, the better the company fits these parameters. This strategy emphasizes fundamental strength, with only a minor role for valuation.
Company card in Stocks Dashboards
In the Stocks Dashboards file, the 1.GEAR tab allows you to view the score for an individual stock, along with additional charts that highlight key performance trends relevant to this strategy.
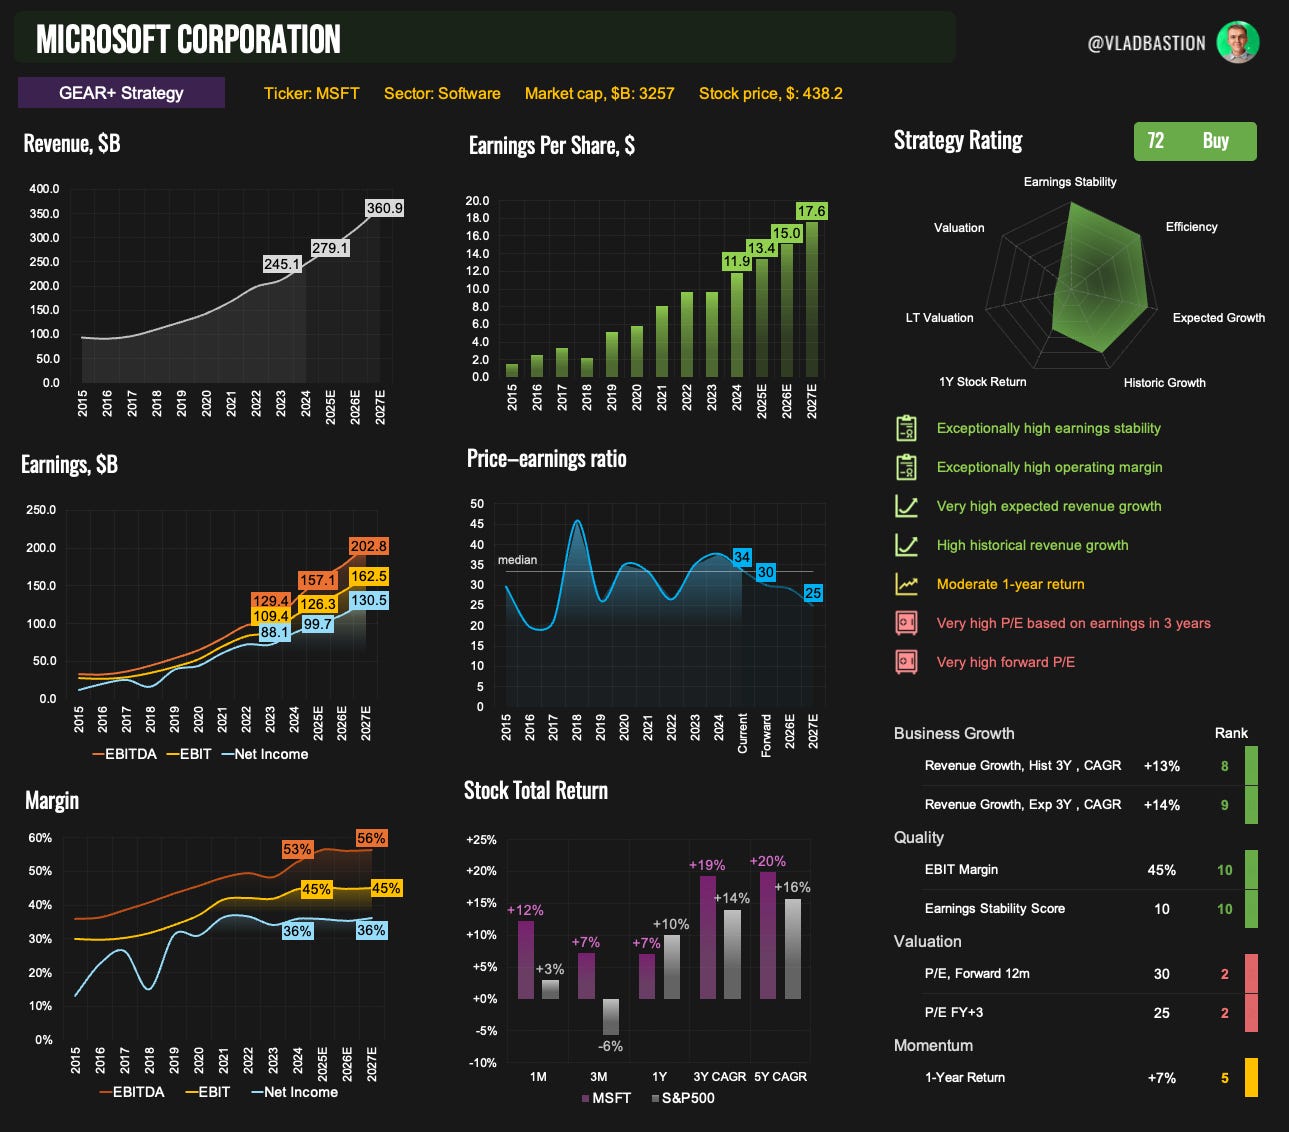
What This Strategy Looks For:
Strong historical and forecasted revenue growth, backed by consensus estimates
High EBIT margins, signaling durable competitive advantages
Stable and predictable earnings (see Earnings Stability Index below)
Moderate valuation — P/E is considered, but not overemphasized
A slight preference for stocks with positive price momentum over the past year
Earnings Stability Index
A custom indicator of earnings consistency, calculated using EPS data over a 5-year period — from FY–3 to the FY+1 forecast.
The company receives 0.5 points for each profitable year
And an additional 1.5 points for each year in which EPS was the highest in the past 4 years
The maximum score is 10, awarded to companies with stable and consistently growing earnings.
Why Include Price Momentum?
Although this is a fundamentally driven strategy, a small weight is assigned to 1-year price performance. Why?
Because all else equal, stocks with positive momentum tend to continue performing well in the short and medium term — a pattern confirmed by both academic research and practical experience. Conversely, a sharp decline in price over the past year often reflects real or expected problems that the market is already pricing in.
Special Case: Banks & Financials
For banks and other financial companies, traditional metrics like Revenue Growth and EBIT Margin are less meaningful due to the nature of their business models.
In those cases, we use:
EPS Growth
Return on Equity (ROE)
These are more relevant indicators of profitability and capital efficiency within the financial sector.
Rebalancing Process
Every quarter, I sit down to review my watchlist, revisit my notes, analyze score updates, and rebalance my portfolio accordingly.
Each stock is assigned a recommended portfolio weight based on two things:
Its updated strategy score
My personal conviction level, supported by a custom internal framework
Dividend Growth Strategy
Core idea:
This strategy focuses on companies that pay dividends and continue to grow their business over time. While value is the top priority, growth and dividend safety also play key roles.
I’m not interested in high-yield names that are value traps — stocks that look cheap but keep underperforming due to structural issues in the business. Instead, I aim to find companies that strike a balance between income, quality, and future potential.
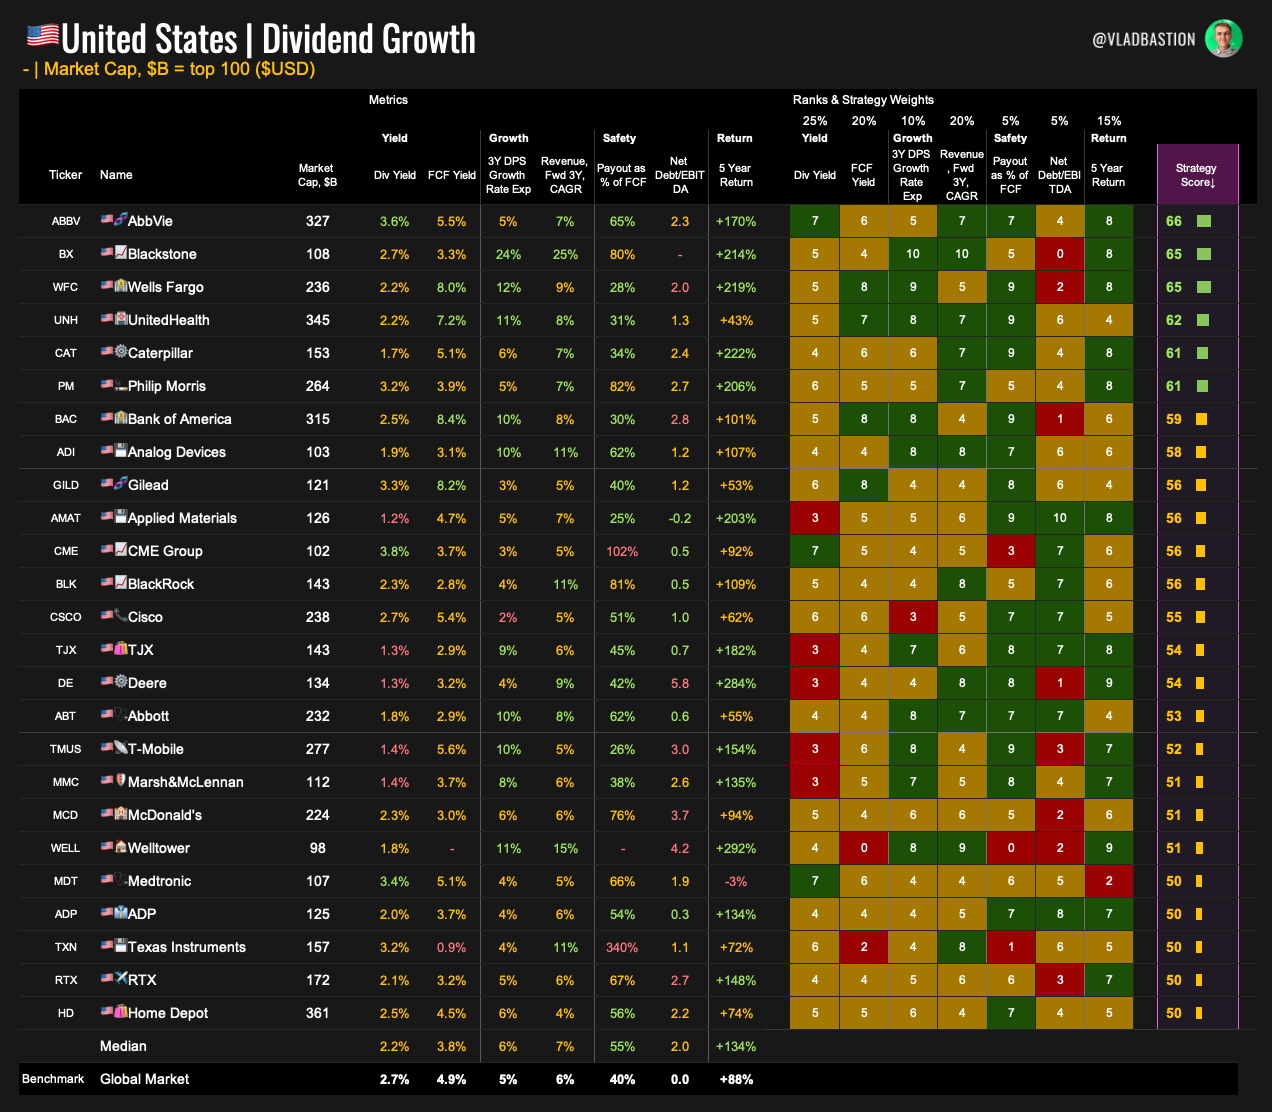
Metrics & Weights:
Dividend Yield – 25%
→ Current dividend income relative to priceFree Cash Flow Yield – 20%
→ Measures how much free cash flow a company generates relative to its market value.3-Year DPS Growth Rate (Expected) – 10%
→ Analyst consensus on forward dividend growthRevenue, Fwd 3Y CAGR – 20%
→ Projected revenue growth over the next 3 yearsPayout as % of FCF – 5%
→ Lower values indicate safer, more sustainable dividendsNet Debt / EBITDA – 5%
→ Measures balance sheet strength and debt load5-Year Total Return – 15%
→ Long-term shareholder value creation
📌Additional filters for portfolio management:
Dividend Yield Score ≥ 2
(Excludes stocks with very low yield)Revenue Growth (Fwd 3Y) Score ≥ 3
(Requires at least moderate growth outlook)
Company card in Stocks Dashboards
On the 2.Dividend tab in the Stock Dashboards file, you can view individual company scores along with key charts.
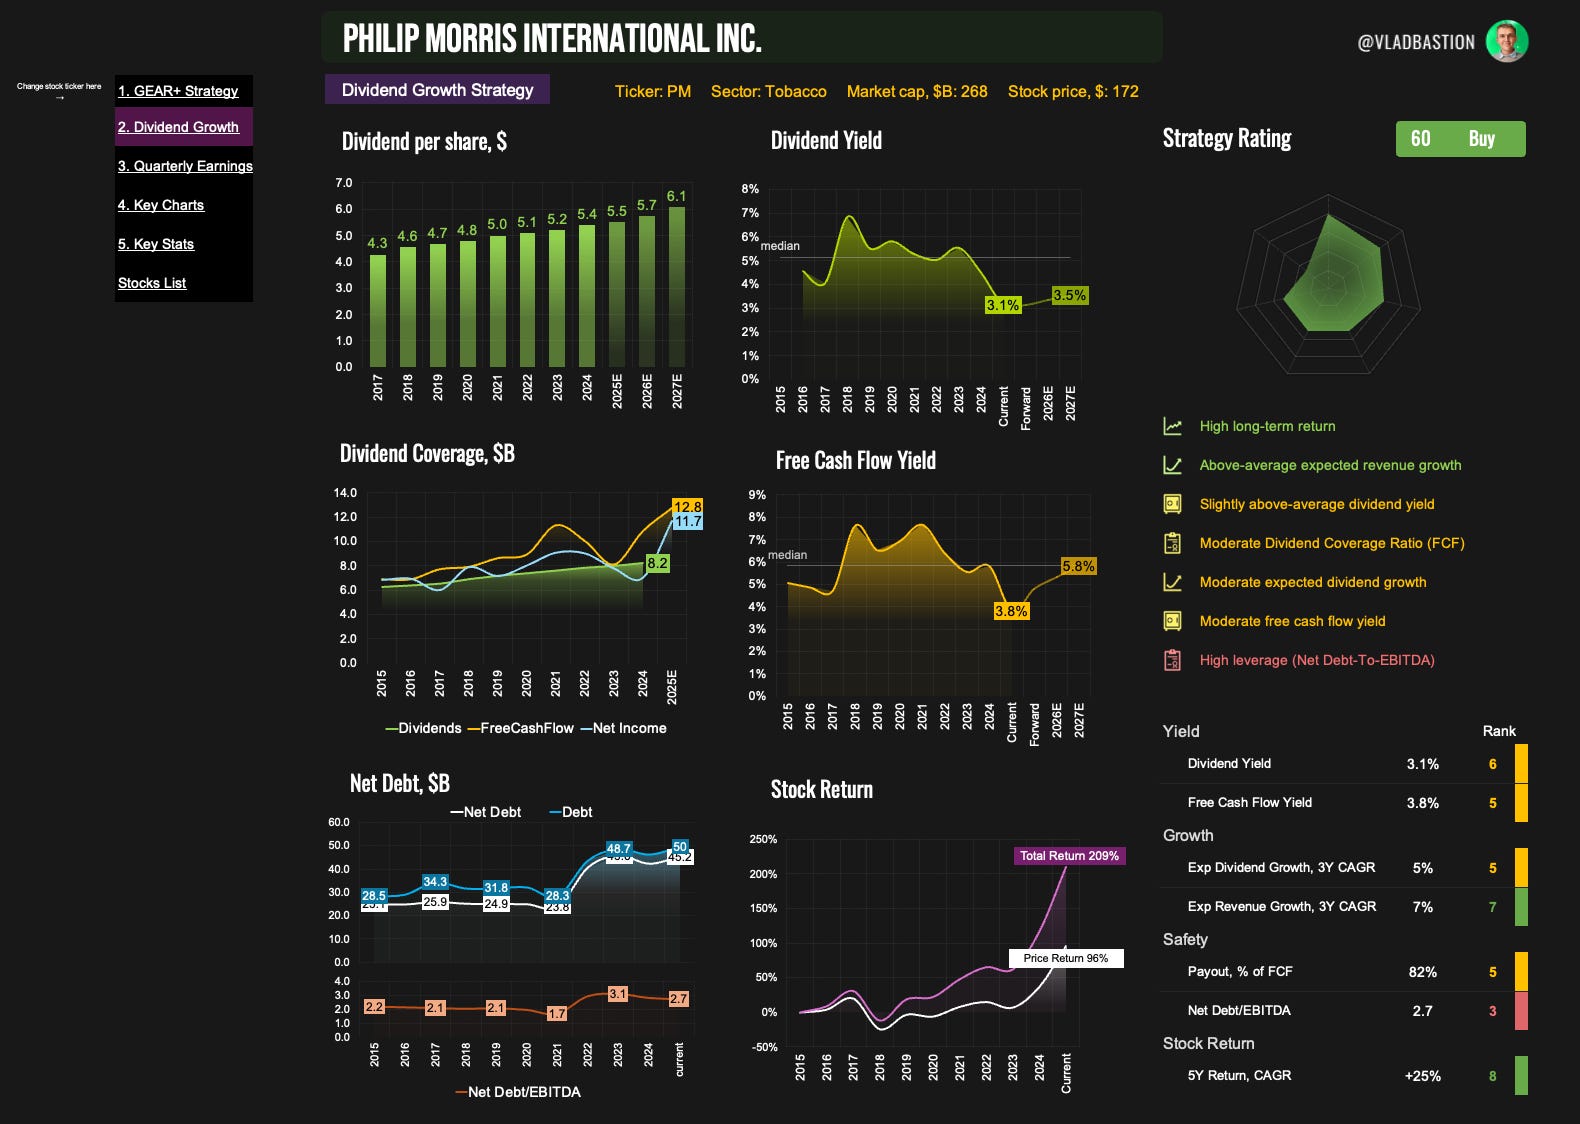
Note on Scores
This strategy tends to produce lower total scores than others. Why?
Finding stocks that combine strong yield and real growth potential is rare. For this strategy, having a total score of 50 or above is already a very strong signal. The goal is not high yield, but balance.
Why Return Matters
I include 5-year total return as a factor in the dividend strategy to evaluate long-term value creation for shareholders. It helps filter out high-yield stocks that have consistently underperformed the market, a common sign of a value trap. Strong long-term returns suggest that the company has not only paid dividends but also delivered capital appreciation, making it a more reliable and balanced investment.
Rebalancing Process
As with the GEAR+ strategy, I review my watchlist, notes, and key charts every three months to make informed decisions about rebalancing.
4. Two Alternative Portfolio Strategies
Alongside my core strategies, I also manage a small allocation for tactical and experimental portfolios. These serve different purposes and play a unique role in how I manage risk, emotion, and idea testing.
Smart Momentum Strategy
Core Idea:
In addition to long-term strategies, I maintain a small speculative portfolio. I believe this is one of the best tools for active asset management — assigning a small slice of capital to test ideas that are often driven by emotion or market noise.
Why?
Because we’re all human — emotional and biased. The biggest risk is falling for a flashy headline or hyped-up story and buying a random stock with half your portfolio. That rarely ends well.
I’ve seen professional portfolio managers do just that with their personal accounts — loading up on junk stocks and blowing up their savings. To avoid this, I channel all emotionally driven decisions into this small trading account, where I’m free to act impulsively — even weekly, if I want.
How I Select Stocks for This Portfolio
Individual ideas I discover from news flow, valuation screens, or unusual activity
Smart Momentum — a custom strategy built specifically for this purpose
What Is Smart Momentum?
Smart Momentum starts as FOMO Momentum — a scoring system focused on stocks with strong recent price action and surging volume.
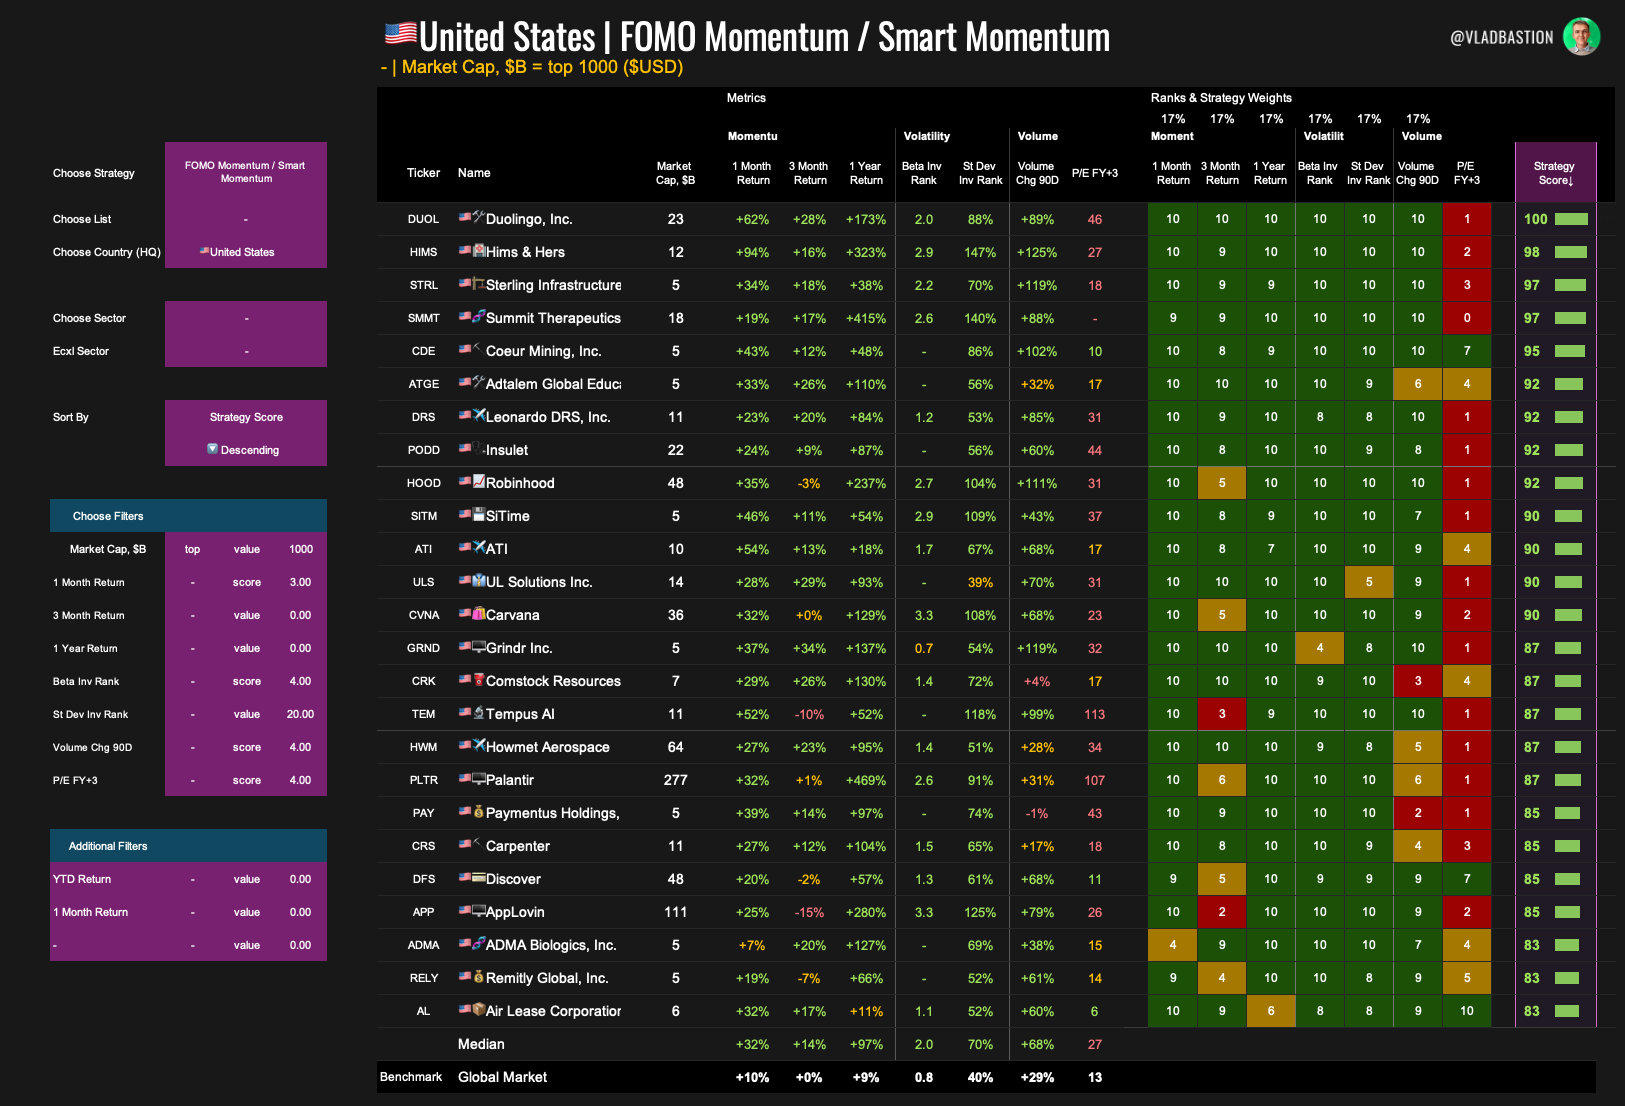
Then it becomes smart by applying a valuation filter, selecting only stocks that are still cheap on a long-term P/E basis.
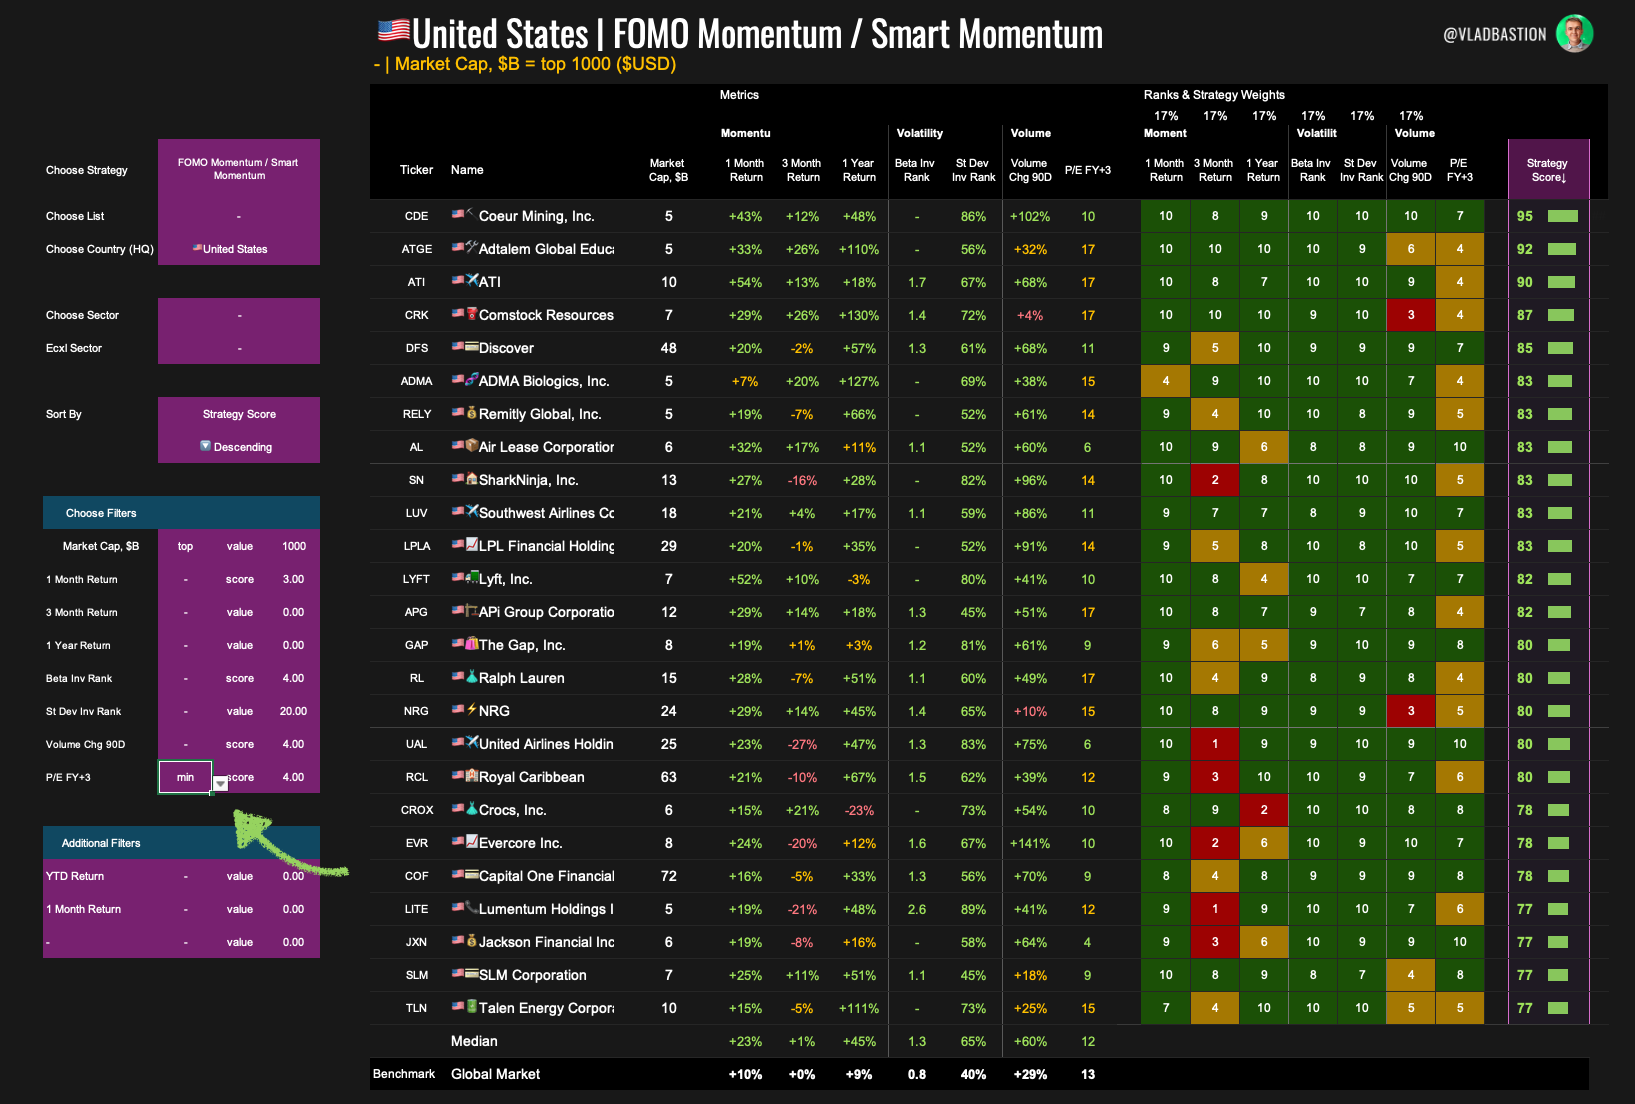
Metrics & Weights:
1-Month Return – 17%
→Measures recent short-term momentum. Strong one-month returns suggest building investor interest.3-Month Return – 17%
→Captures early trend formation — stocks that have been consistently gaining over a quarter.1-Year Return – 17%
→Long-term momentum. Stocks that have outperformed over 12 months are more likely to keep doing so in the short term.Inverted Beta Rank – 17%
→Higher beta (more volatile stocks) score higher.Inverted Standard Deviation Rank – 17%
→Similar to Beta Rank, but based on historical price fluctuation. A higher standard deviation gets a higher score.Volume Change (90 Days) – 17%
→Measures the relative increase in trading volume over the past 3 months. Spiking volume often confirms institutional interest and real momentum.P/E FY+3 – 0% (used as a filter only)
→Not included in the score itself, but used to filter out overvalued names. For a stock to qualify under Smart Momentum, it must have a P/E FY+3 score of at least 4, meaning it's not expensive on a 3-year forward earnings basis.
📌 Filter (for Smart Momentum):
Only include stocks where P/E FY+3 Score ≥ 4
Rebalancing Process
There’s no fixed schedule. Sometimes new ideas emerge weekly. Other times, nothing shows up for a month. This is a flexible, opportunistic trading portfolio — driven by instinct, trend, and experimentation.
Buy The Fortress Dip Strategy
Core Idea:
This idea came to me in 2020. What if we buy stocks that have significantly underperformed the market, but still show strong long-term growth and efficiency potential?
This strategy focuses on "fortress companies" — high-quality businesses temporarily out of favor.
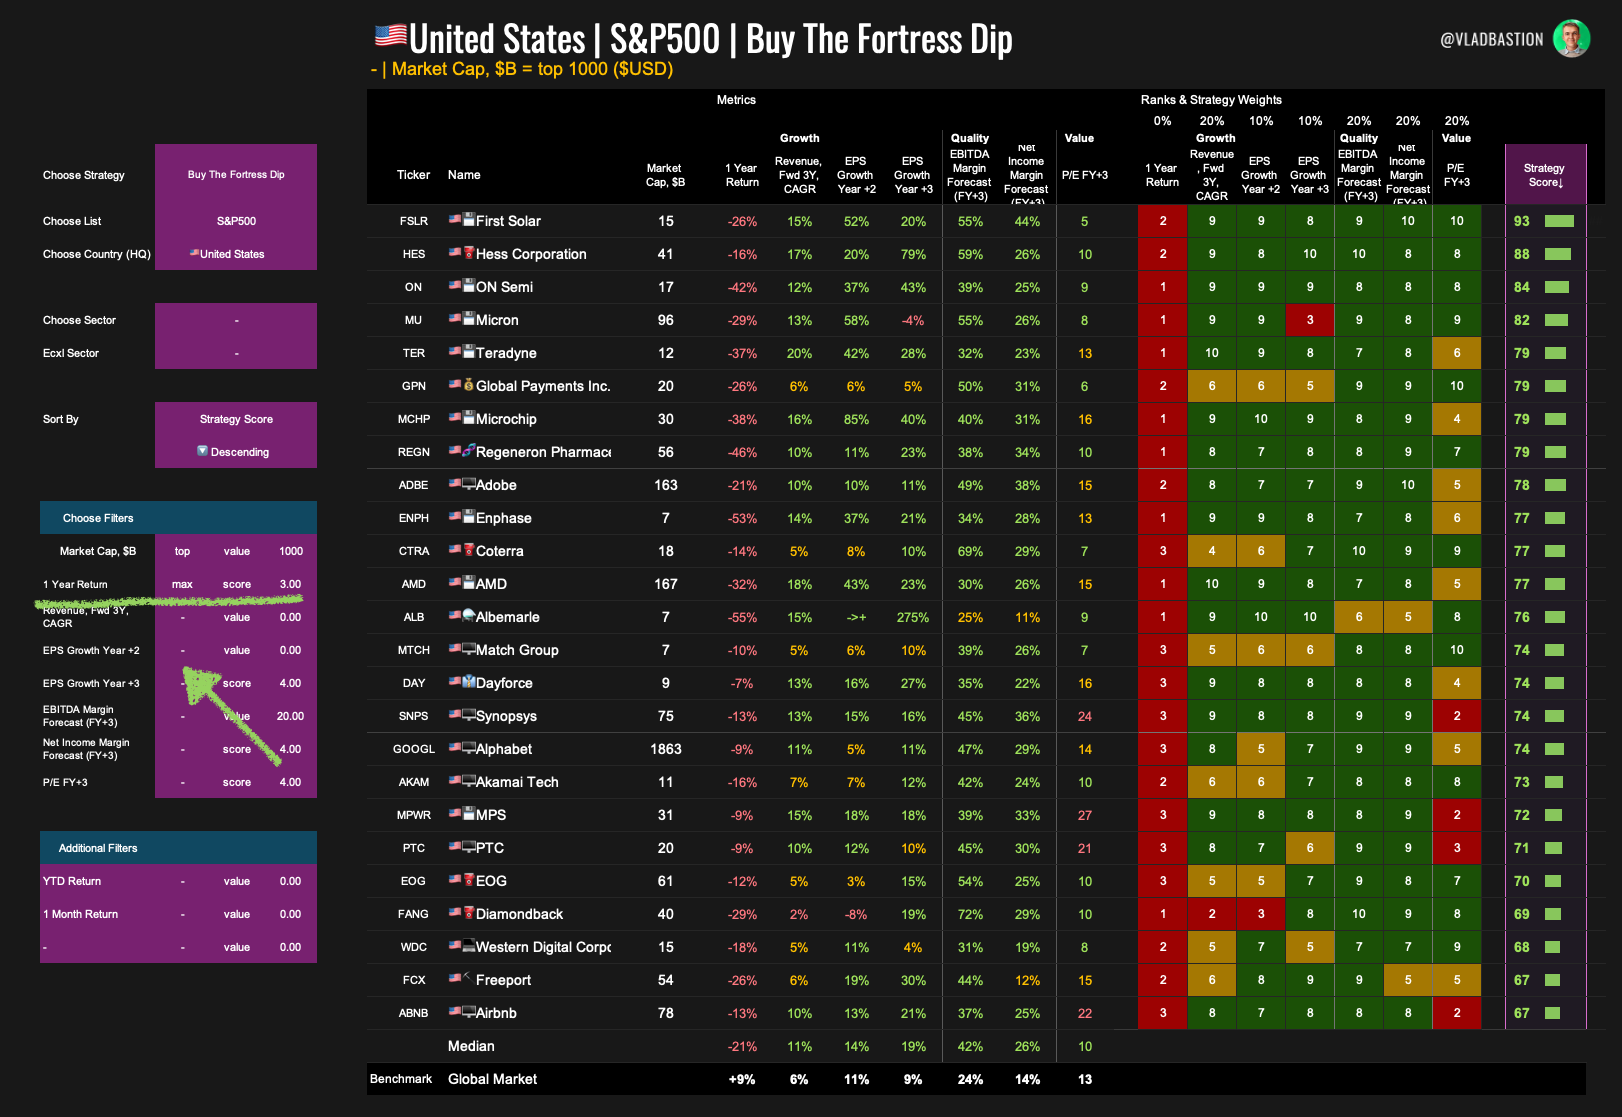
Metrics & Weights:
1-Year Return – 0% (Filter only)
→Used solely as a filter. Only includes stocks with a score of 3 or lower (bottom 30% of the market) — significantly underperforming over the past year.Revenue, Fwd 3Y CAGR – 20%
→Measures expected revenue growth over the next 3 years. Focuses on companies with strong top-line growth potential despite recent price weakness.EPS Growth Year +2 – 10%
→Forecasted earnings growth two years ahead. Helps identify recovery stories with improving profitability on the horizon.EPS Growth Year +3 – 10%
→Longer-term earnings growth outlook. Rewards companies expected to rebuild momentum further out.EBITDA Margin Forecast (FY+3) – 20%
→Projected operating margin three years from now. A signal of future efficiency and operating leverage.Net Income Margin Forecast (FY+3) – 20%
→Forecasted net profitability three years ahead. Focuses on bottom-line strength returning over time.P/E FY+3 – 20%
→Valuation based on earnings expected three years from now. Ensures companies are not just rebounding, but also reasonably priced.
📌 Filter:
Only include stocks where 1-Year Return Score ≤ 3 (i.e. significant underperformance)
Rebalancing Process
Once a year, I select 10 of these “fallen fortress” stocks and rebalance the portfolio.
This strategy is a pure intellectual experiment, but I track it carefully to learn from the results and market behavior.
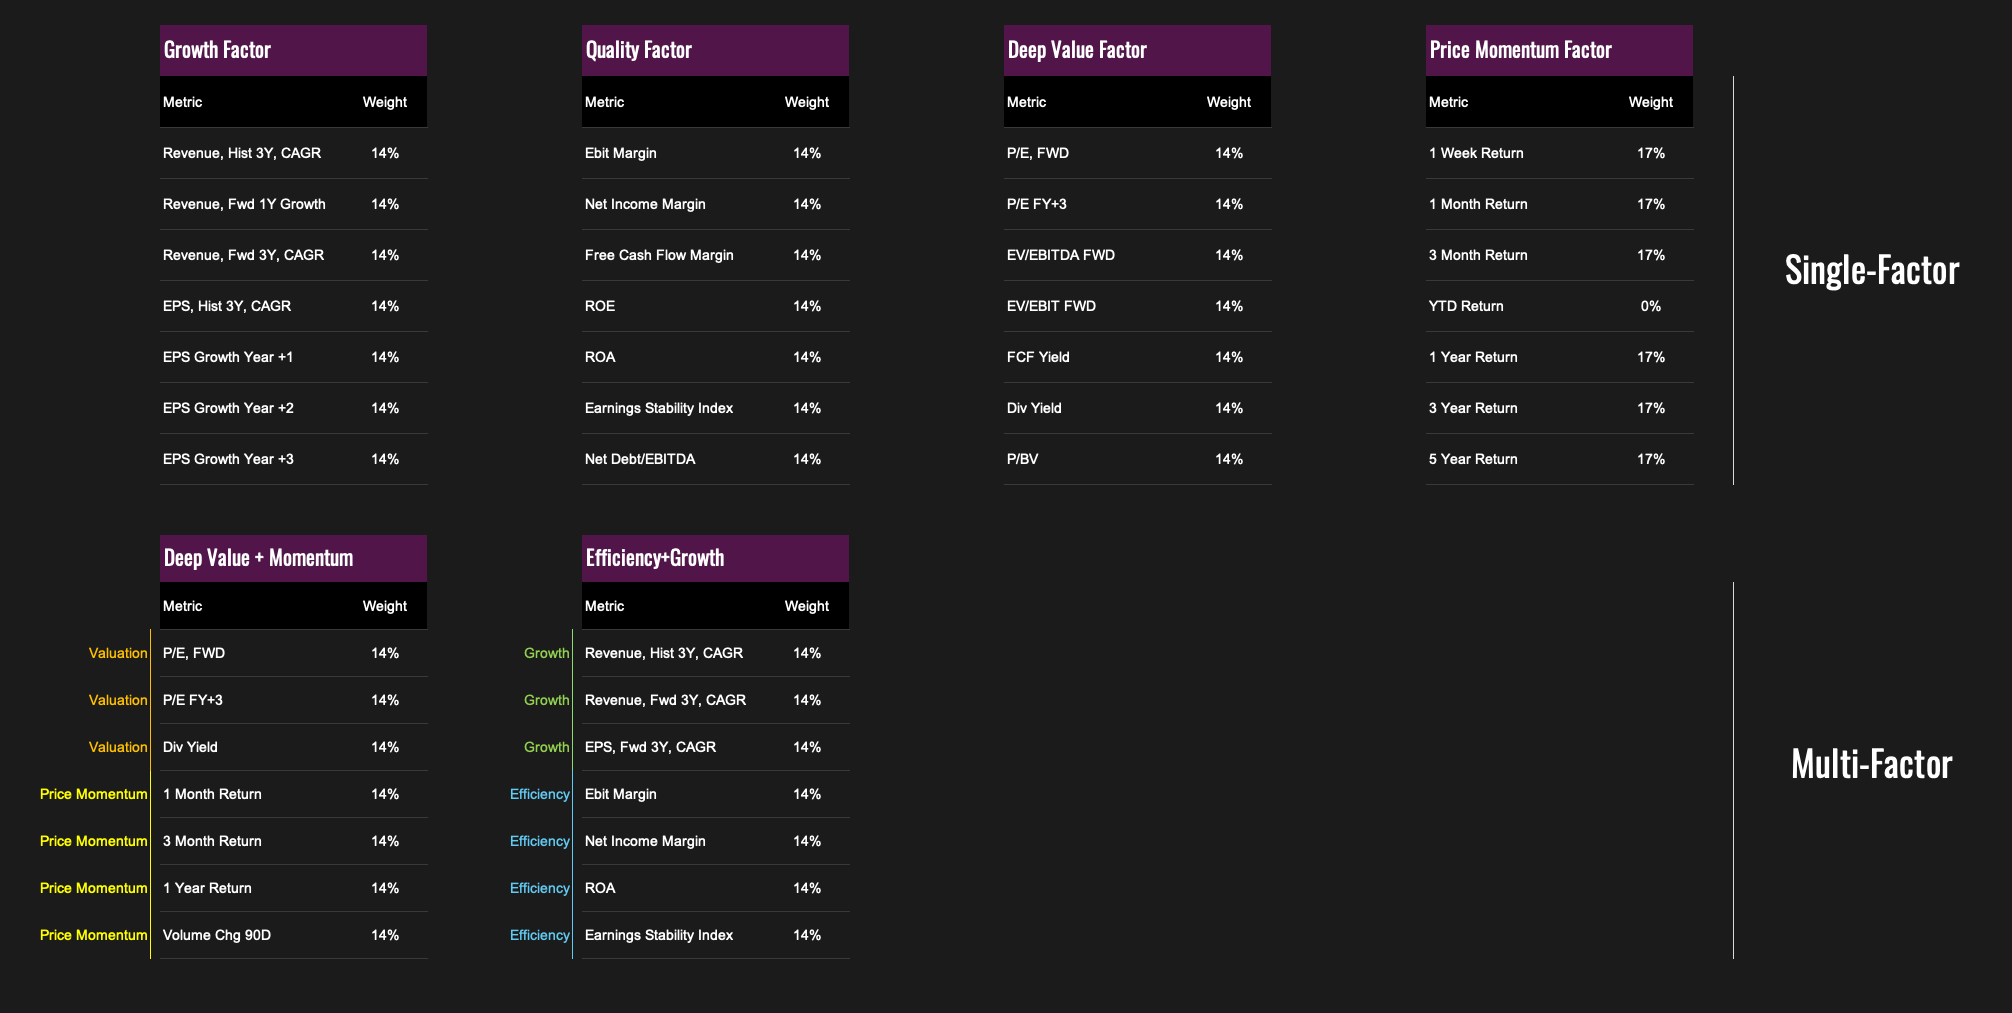
5. Additional Scoring Models
In addition to core strategies, I maintain several single-factor and hybrid models within the Bastion Strategy Builder.
Why include them?
Market context:
These scores help track what types of companies are currently in favor or under pressure. Who’s growing fastest? Which sectors are losing momentum? Are margins compressing or expanding?Idea generation:
Auxiliary strategies often spark new hypotheses or suggest improvements to my core models.
Growth Factor — Measuring Business Expansion
Core Idea:
Focuses on both historical and projected revenue and earnings growth.
Forecasts are based on analyst consensus gathered from both free and premium sources.
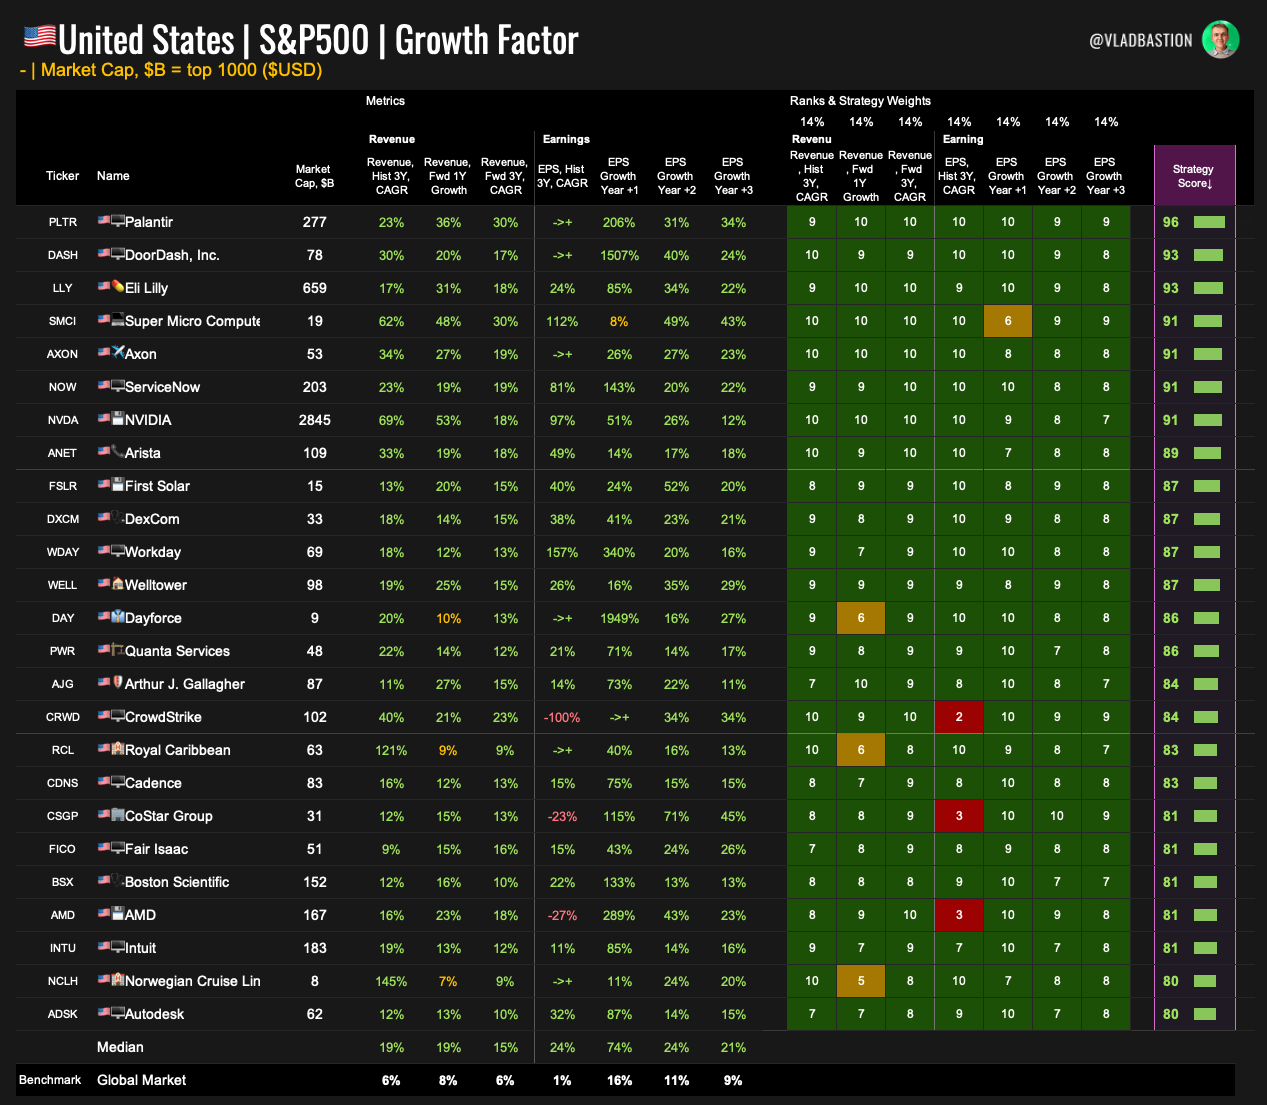
Metrics & Weights:
Revenue, Hist 3Y CAGR – 14%
→Measures actual revenue growth over the past 3 years. A strong history of top-line expansion is a key indicator of business momentum.Revenue, Fwd 1Y Growth – 14%
→Analyst-projected revenue growth for the next year. Useful for capturing near-term acceleration.Revenue, Fwd 3Y CAGR – 14%
→Consensus revenue forecast over a 3-year horizon. Captures long-term business scaling potential.EPS, Hist 3Y CAGR – 14%
→Measures historical growth in earnings per share — signals consistent bottom-line expansion.EPS Growth Year +1 – 14%
→One-year forward EPS growth forecast. Helps identify companies with strong upcoming profitability.EPS Growth Year +2 – 14%
→Two-year forward EPS forecast. Adds visibility into sustained earnings strength.EPS Growth Year +3 – 14%
→Long-range EPS growth forecast — useful for identifying companies with deeper earnings cycles.
Quality Factor — Measuring Business Strength
Core Idea:
Focuses on profitability, capital efficiency, and financial resilience.
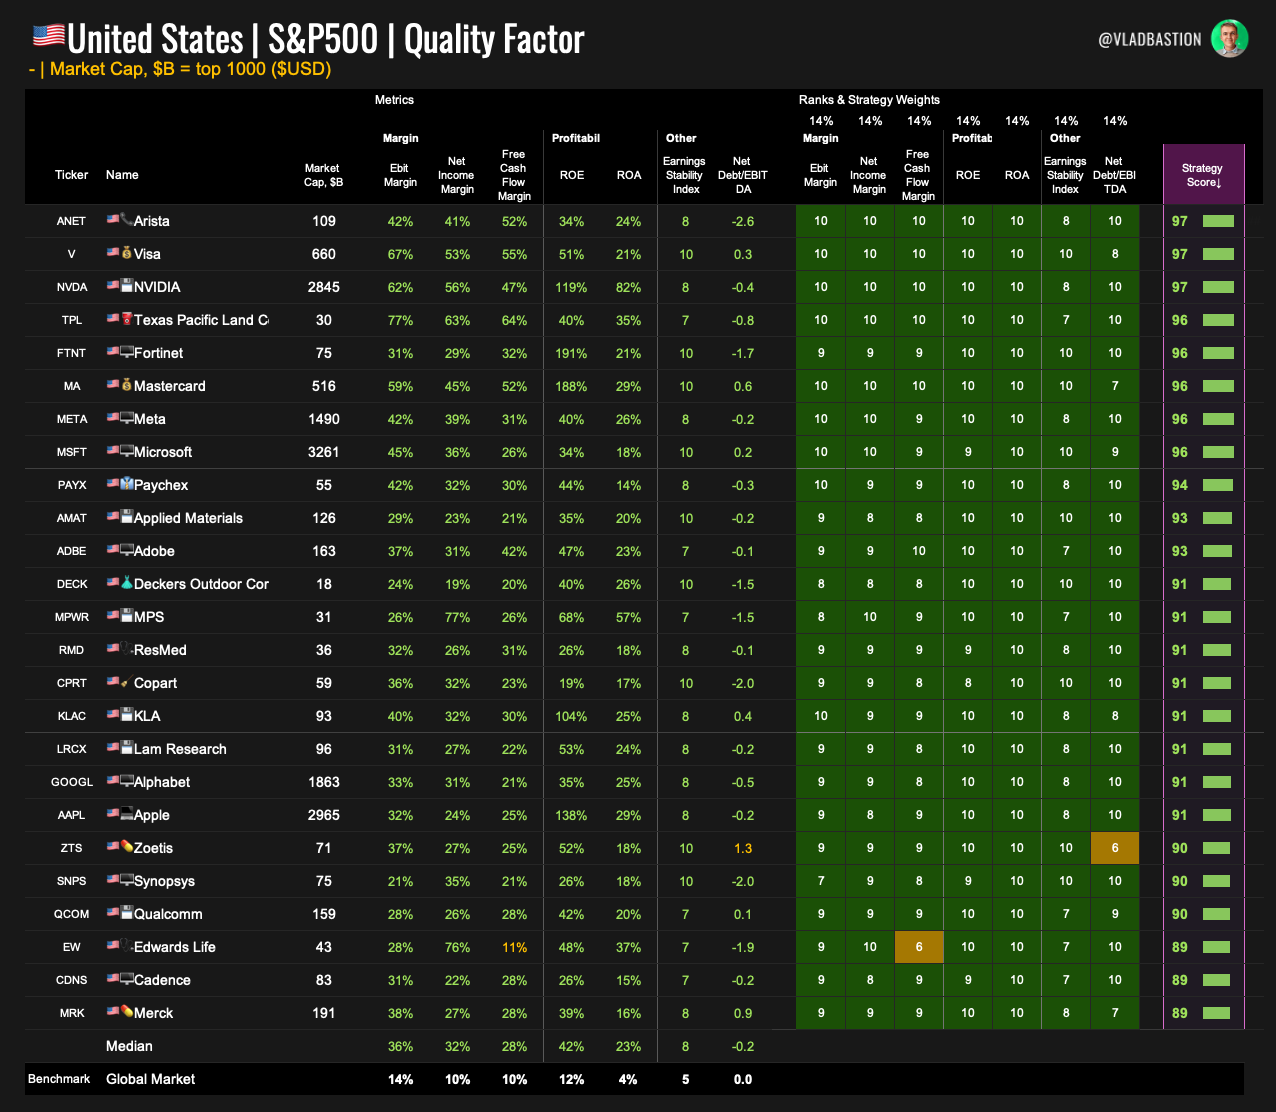
Metrics & Weights:
EBIT Margin – 14%
→Measures core operating profitability. A high EBIT margin indicates operational discipline and pricing power.Net Income Margin – 14%
→Bottom-line profitability after all expenses. Helps assess overall financial health.Free Cash Flow Margin – 14%
→Percentage of revenue converted into free cash flow. A key metric for self-funding and dividend potential.Return on Equity (ROE) – 14%
→Measures how effectively a company uses shareholder capital to generate profits.Return on Assets (ROA) – 14%
→Captures how efficiently a company uses all its assets to drive net income.Earnings Stability Index – 14%
→A custom Bastion metric that scores EPS consistency over a 5-year period (FY–3 to FY+1), based on profitability and earnings peaks.Net Debt / EBITDA – 14%
→Assesses leverage and balance sheet strength. Lower values indicate stronger financial flexibility.
Deep Value Factor — Finding True Bargains
Idea:
Targets fundamentally undervalued companies based on classic valuation multiples.
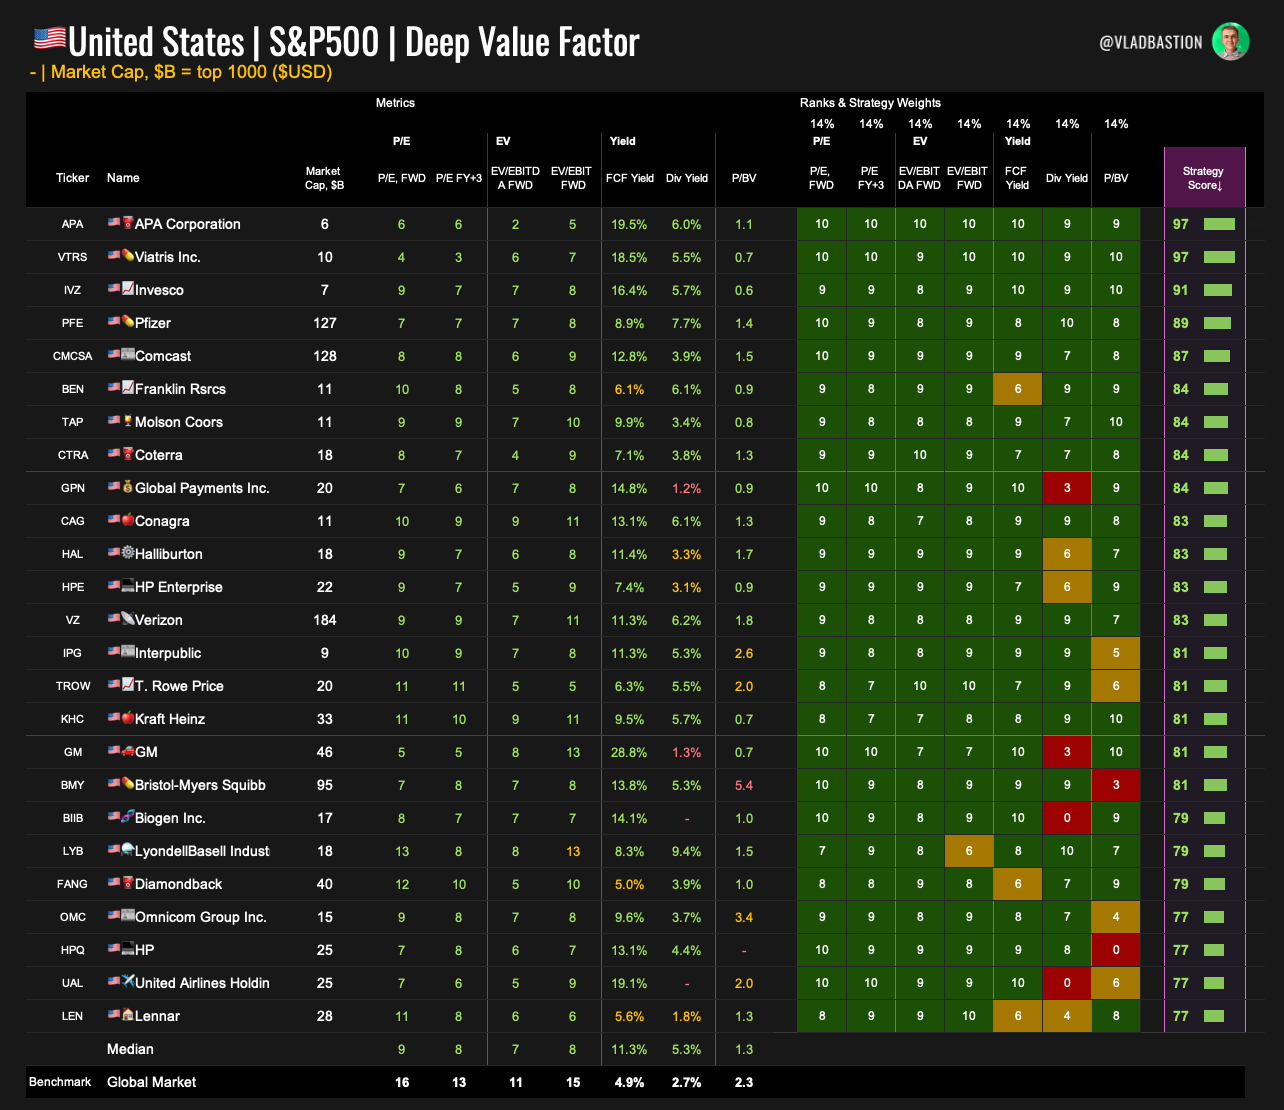
Metrics & Weights:
P/E Forward – 14%
→Valuation relative to next year’s projected earnings. Classic "cheapness" metric.P/E FY+3 – 14%
→Forward-looking P/E based on earnings in three years. Helps avoid near-term earnings dips.EV/EBITDA Forward – 14%
→Enterprise value to EBITDA ratio. Reflects operating value of the business.EV/EBIT Forward – 14%
→Focuses on operating earnings after depreciation. Useful for capital-heavy industries.Free Cash Flow Yield – 14%
→Measures the return on investment based on free cash flow. A strong indicator of value.Dividend Yield – 14%
→Assesses income return from dividends. Helps find income-generating stocks.Price-to-Book (P/BV) – 14%
→Compares market value to balance sheet equity.
Price Momentum Factor — Riding the Trend
Idea:
Measures recent and long-term price strength. The behavioral insight: winners tend to keep winning.
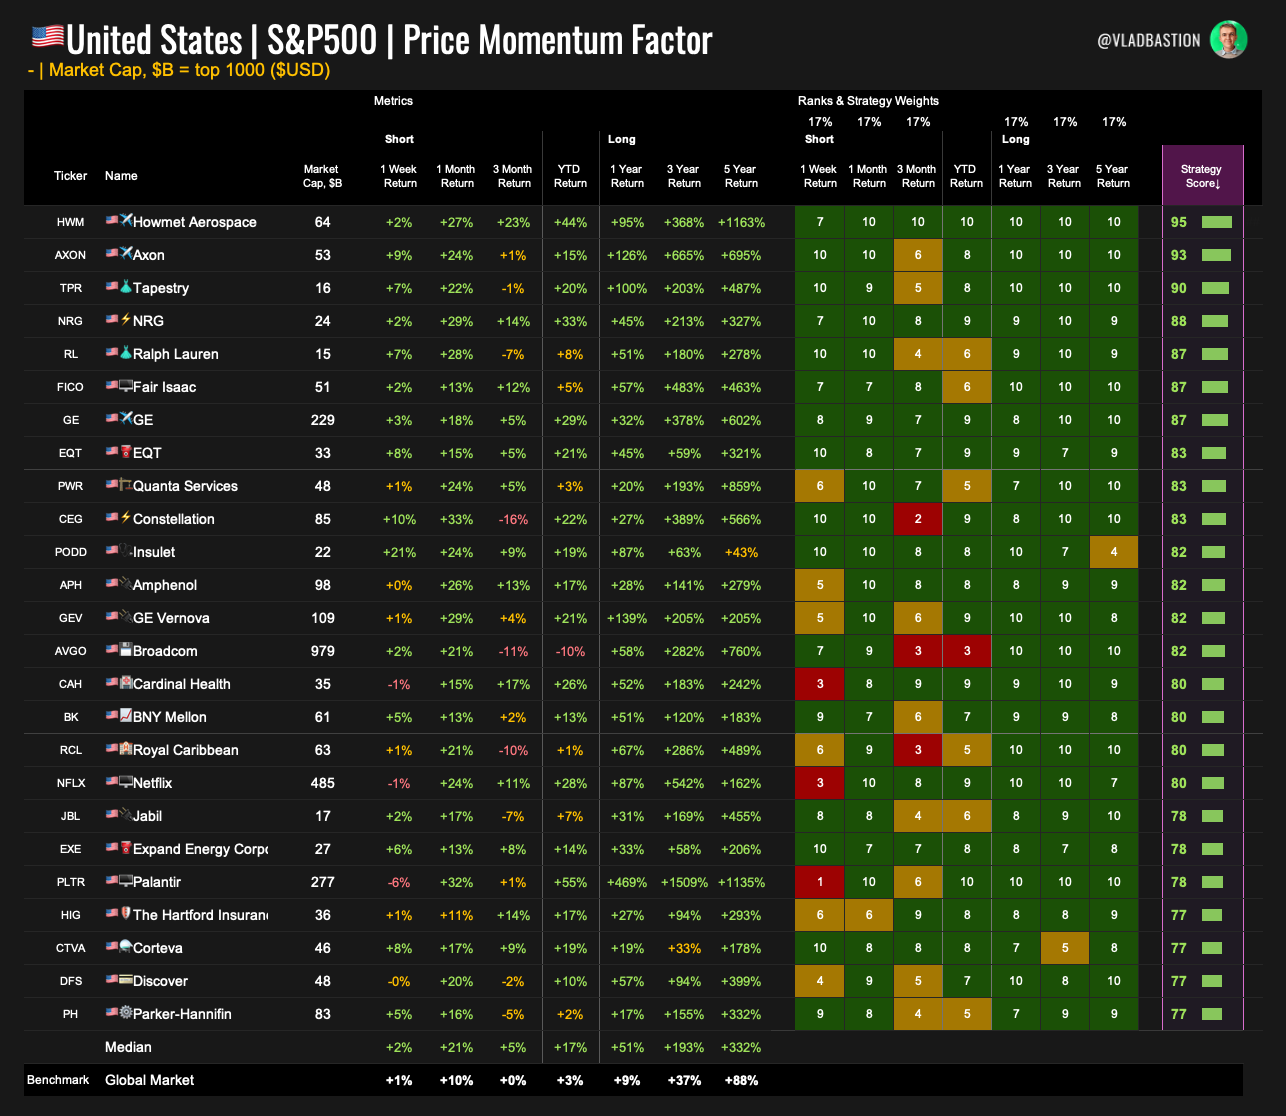
Metrics & Weights:
1-Week Return – 17%
→Captures immediate price action. Useful for short-term trend detection.1-Month Return – 17%
→Measures near-term price strength — often the start of momentum cycles.3-Month Return – 17%
→Confirms ongoing positive movement in price.YTD Return – 0%
→Intentionally excluded from scoring.1-Year Return – 17%
→Signals long-term market outperformance and strong sentiment.3-Year Return – 17%
→Looks at mid-term performance. Helps distinguish true winners.5-Year Return – 17%
→Captures deep structural winners and compounders.
Deep Value + Momentum — Cheap but Rising
Idea:
Combines valuation and price strength — a hybrid model to find undervalued stocks gaining traction.
Metrics & Weights:
Valuation:
P/E Forward – 14%
P/E FY+3 – 14%
Dividend Yield – 14%
Momentum:
1-Month Return – 14%
3-Month Return – 14%
1-Year Return – 14%
Volume Change (90D) – 14%
Efficiency + Growth — Smart Growth at Its Best
Idea:
Targets companies that grow rapidly and efficiently, focusing on margins, capital use, and profit consistency.
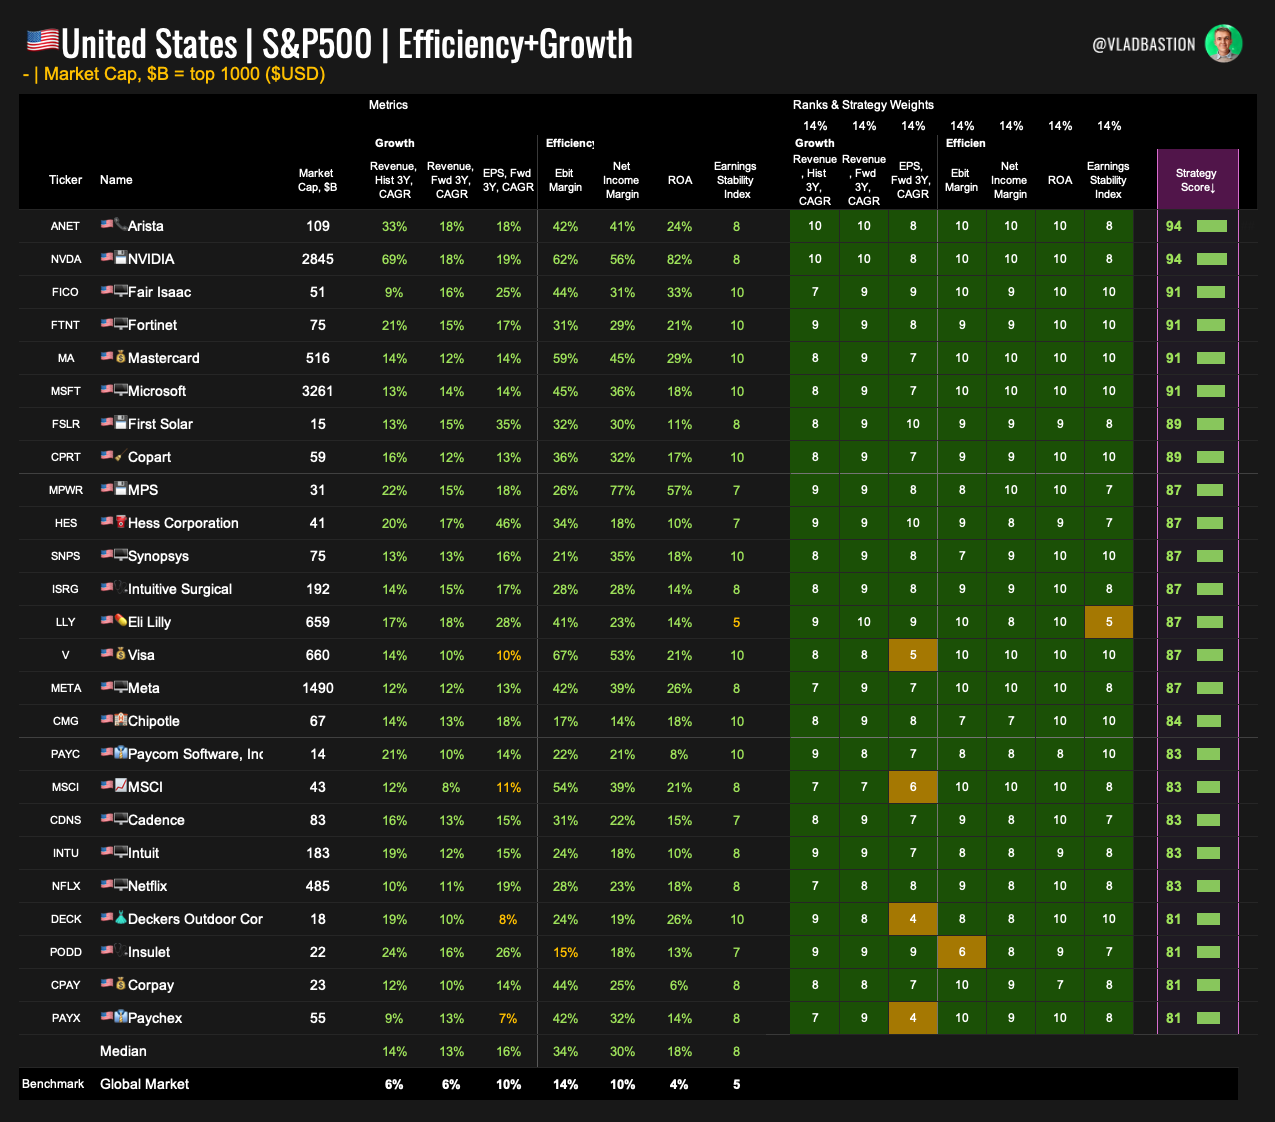
Metrics & Weights:
Growth:
Revenue, Hist 3Y CAGR – 14%
Revenue, Fwd 3Y CAGR – 14%
EPS, Fwd 3Y CAGR – 14%
Efficiency:
EBIT Margin – 14%
Net Income Margin – 14%
ROA – 14%
Earnings Stability Index – 14%
Wrapping up
Investing is about making decisions under uncertainty. Traditional methods — from DCF models to simple multiples — are often too subjective, too simplistic, or not scalable.
The scoring approach used in Bastion helps address these issues through objectivity, flexibility, automation, and consistency.
It provides a structured way to highlight companies that align with specific investment goals — whether you're focused on growth, efficiency, value, or resilience.
It doesn’t replace in-depth research, but offers a strong starting point and a level of discipline that’s essential for sound decision-making.
Instead of random picks or emotionally driven trades, you get a system to surface ideas, test hypotheses, and build portfolios aligned with your own logic and style.
Bastion is more than a stock selection tool — it’s a framework for thinking clearly in a noisy, crowded market.