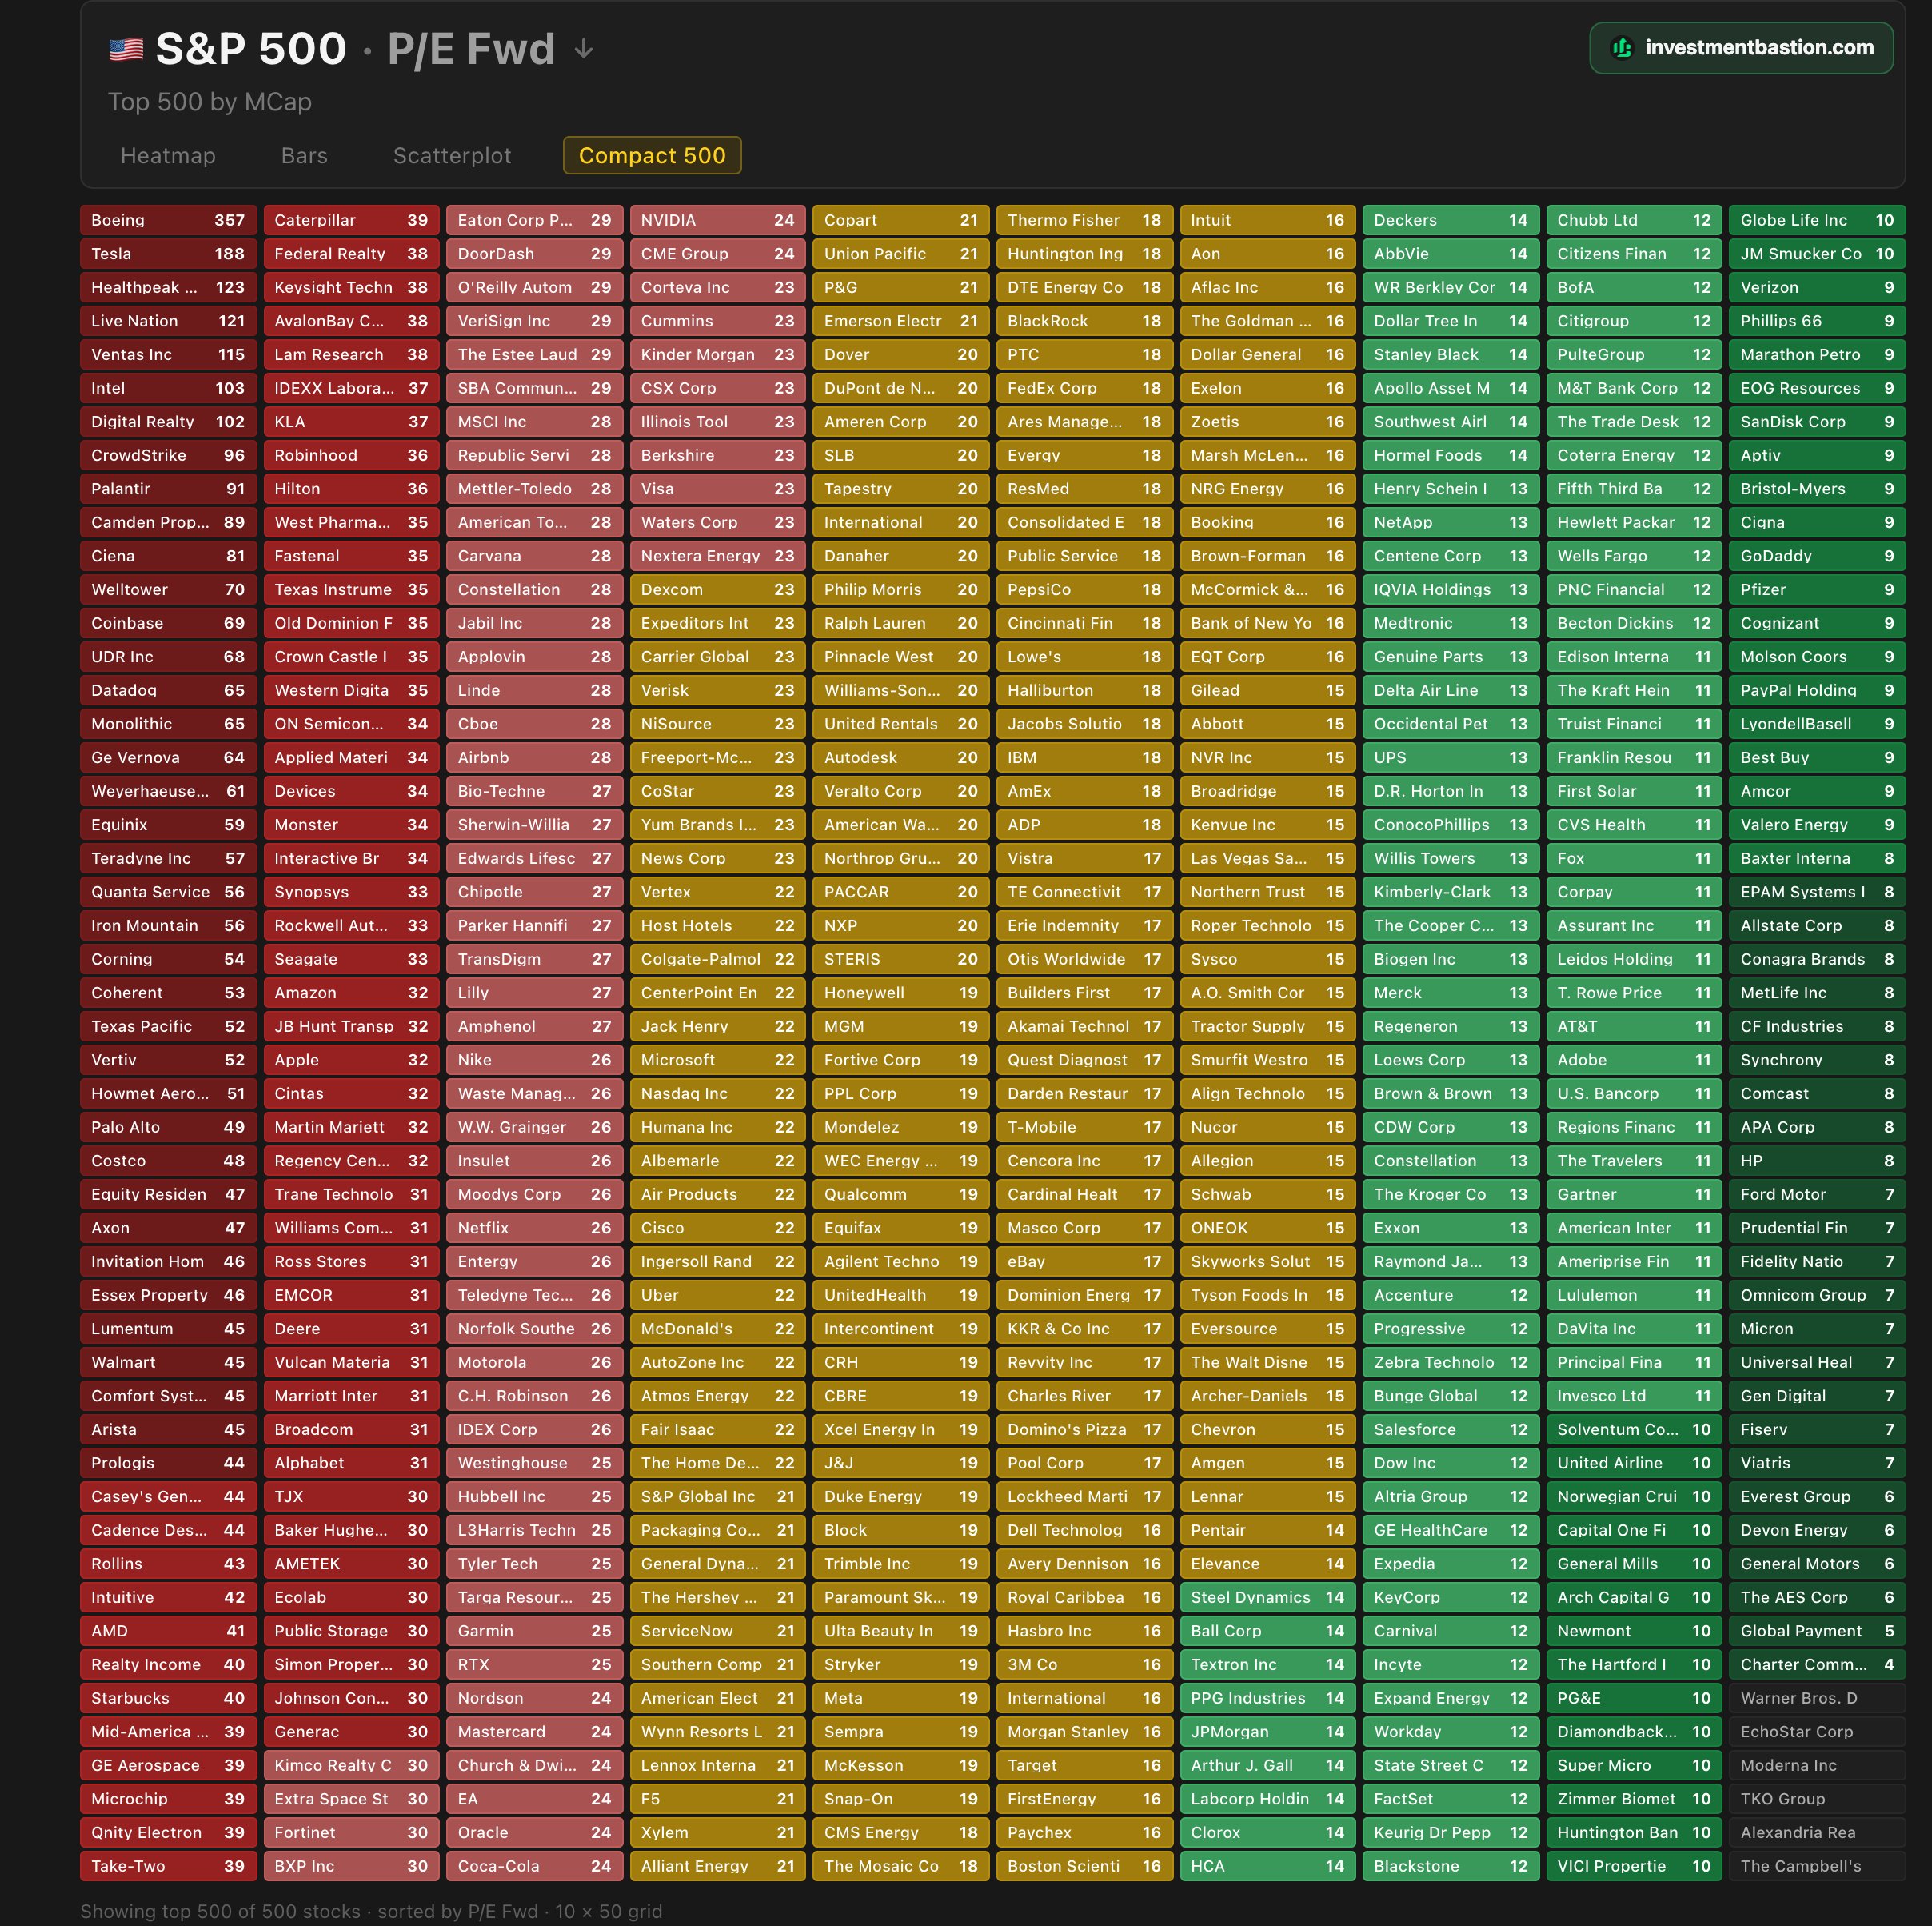
New Heatmap: 500 Stocks on a Single Screen
We just shipped the Compact 500 view — a new way to see the entire S&P 500 on a single visualization.
What's new:
Each stock is a compact tile showing the ticker, company name, and its metric value. Color coding instantly tells you which stocks score highest and lowest on any metric — P/E, Growth, Quality, Value, or any of the 70+ fundamentals we track.
Why it matters:
Most heatmaps show you 50-100 stocks and call it a day. We fit all 500 in one view, sorted by market cap, so you can spot patterns at a glance — which sectors are cheap, which mega-caps are overvalued, where momentum is clustering.
How to use it:
Head to the Heatmap page → switch to the "Compact 500" tab → pick any metric from the dropdown. Works with every list and every scoring strategy.
Try it now at investmentbastion.com/heatmap